Climate Plan

PAGES AT ARCTIC-NEWS BLOG

Wednesday, April 27, 2022

Carbon dioxide crosses 422 ppm

Carbon dioxide (CO₂) reached an average daily concentration of 422.06 ppm on April 26, 2022, at Mauna Loa, Hawaii.


Furthermore, very high methane (CH₄) concentrations were recorded recently at Mauna Loa, Hawaii, with surface flask readings appearing to be as high as 1955 ppb.  


Clouds tipping point

A methane concentration of 1955 ppb corresponds, at a Global Warming Potential (GWP) of 200, with a carbon dioxide equivalent (CO₂e) of 391 ppm. Together with the above daily average CO₂ concentration of 422.06 ppm this adds up to a joint CO₂e of 813.06 ppm, i.e. less than 387 ppm away from the clouds tipping point (at 1200 ppm CO₂e) that on its own could raise the global temperature by 8°C.

Such a 387 ppm CO₂e could be added almost immediately by a burst of seafloor methane less than the size of the methane that is currently in the atmosphere (about 5 Gt). There is plenty of potential for such an abrupt release, given the rising ocean heat and the vast amounts of methane present in vulnerable sediments at the seafloor of the Arctic Ocean, as discussed in posts such as this one.


The 1200 ppm CO₂e clouds tipping point could also be crossed even without such an abrupt seafloor methane release. Carbon dioxide and methane levels are rising rapidly. The above image shows carbon dioxide concentration with a trend added, based on NOAA 1980-2021 mean global annual carbon dioxide data, illustrating how carbon dioxide concentration could cross 750 ppm by the end of the year 2029.

[ see also the importance of methane ]

The above image shows methane concentration with a trend added, based on NOAA 2008-2021 mean global annual methane data, illustrating how methane concentration could cross 4100 ppb by the end of the year 2029 and how methane's impact could cross 820 ppm CO₂e by the end of the year 2029.

As illustrated by the image below, 750 ppm carbon dioxide and 820 ppm CO₂e methane would together yield a joint CO₂e of 1570 ppm and thus would have already raised the global temperature by 8°C due to the clouds feedback much earlier than 2029, while the temperature rise would also have been driven up by the higher carbon dioxide and the methane concentrations. 


Furthermore, nitrous oxide is also rising and there are many further forcers, as discussed at the Extinction page. Altogether, there is the potential for a temperature rise of well over 18°C by 2026, as discussed in an earlier post.

Such high carbon dioxide concentrations could occur due to forest fires causing soils to burn (especially peat soils), which can also add vast amounts of methane to the atmosphere. 

The IPCC does contemplate high carbon dioxide scenarios (see image right), but as discussed in an earlier post, does not mention the clouds tipping point.

High carbon dioxide scenarios typically stop at the year 2100 and rarely do concentrations reach higher than 1200 ppm.

In the image on the right, from a 2020 analysis by Malte Meinshausen et al., the SSP5-8.5 scenario is extended to the year 2300 and a carbon dioxide concentration of well over 2100 ppm is reached around 2240.

In conclusion, there is plenty of scientific consideration of the potential for high concentrations of carbon dioxide and methane to eventuate, but it is typically ignored or waved away as too distant in the future to worry about. 

In other words, what's lacking is analysis of abrupt catastrophic climate change.

Climate change danger assessment

The image below expands risk assessment beyond its typical definition as the product of the severity of impact and probability, by adding a third dimension: timescale.

Water in soil and atmosphere

The image on the right, from a news release associated with a recent study, shows changes in atmospheric thirst, measured in terms of reference evapotranspiration from 1980-202 (in mm).

As temperatures rise due to people's emissions, more evaporation will take place over both land oceans, but not all water will return as precipitation, so more water vapor will stay in the air.

[ click on images to enlarge ]
The water-holding capacity of the atmosphere increases by about 7% for every 1°C (1.8°F) rise in temperature, in line with the Clausius–Clapeyron relation

In many cases, this means drier soils and vegetation, making vegetation more vulnerable to pests and diseases, and more prone to fire hazards. 

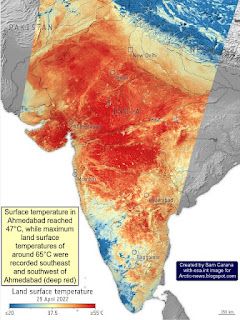
Water in the soil acts as a buffer, slowing down the temperature rise, so drier soil will heat up faster and further, causing land surface temperatures to rise even more and amplifying the impact of Urban heat island and Heat dome phenomena.

The image on the right, adapted from ESA, shows land surface temperatures as high as 65°C (149°F) in India on April 26, 2022. Note that land surface temperatures can be substantially higher than air temperatures. 

As temperatures rise, extreme weather events increase in frequency and intensity. The duration of extreme weather events can also increase, due to blocked weather patterns resulting from changes to the Jet Stream.

This contributes to shortages in food and water supplies. As long as glaciers are melting in the mountains, rivers will keep supplying some water, but the snow and ice cover is disappearing rapidly around the globe. 

The image on the right shows that food prices have risen strongly over the past few years and extreme weather events resulting from the global temperature rise have strongly contributed to the price rise. 

Further contributing to this rise is the rising demand for fertilizers that are currently all too often produced with fossil fuel, as political will to produce food in better ways remains lacking. 

Heat stress

Another issue is humidity. The more water vapor there is in the air, the harder temperature peaks are to bear.

The human body can cool itself by sweating, which has a physiological limit that is often described as a 35°C wet-bulb temperature

A 2020 study (by Raymond et al.) warned that this limit could be regularly exceeded with a temperature rise of less than 2.5°C (compared to pre-industrial).

Meanwhile, recent research found that in practice the limit will typically be lower and depending on circumstances could be as low as a wet-bulb temperature of 25°C.

In the video below, Paul Beckwith discusses the danger of combined high heat and humidity. 


In the video below, Guy McPherson also discusses the danger of combined high heat and humidity. 


Extinction

A 2018 study (by Strona & Bradshaw) indicates that most life on Earth will disappear with a 5°C rise. Humans, who depend for their survival on many other species, will likely go extinct with a 3°C rise, as illustrated by the image below, from an earlier post.


Conclusion

This further highlights the imminence of the danger and adds further urgency to the call for immediate, comprehensive and effective action, as described in the Climate Plan.


Links

• NOAA - Global Monitoring Laboratory, Recent Daily Average CO₂ at Mauna Loa, Hawaii, U.S. 
• NOAA - Global Monitoring Laboratory, Methane (surface flasks) at Mauna Loa, Hawaii, U.S. 
• The Importance of Methane
https://arctic-news.blogspot.com/p/the-importance-of-methane-in-climate.html

• Clouds feedback and tipping point
https://arctic-news.blogspot.com/p/clouds-feedback.html

• NOAA - Globally averaged marine surface annual mean carbon dioxide data
https://gml.noaa.gov/webdata/ccgg/trends/co2/co2_annmean_gl.txt

• NOAA - Globally averaged marine surface annual mean methane data
https://gml.noaa.gov/webdata/ccgg/trends/ch4/ch4_annmean_gl.txt

• NOAA - Mauna Loa CO2 weekly mean and historical comparisons
https://gml.noaa.gov/webdata/ccgg/trends/co2/co2_weekly_mlo.txt

• Methane rise is accelerating

• Runaway temperature rise by 2026?
• Extinction
https://arctic-news.blogspot.com/p/extinction.html

• Shortcomings of IPCC AR6 WGIII - Mitigation of Climate Change
https://arctic-news.blogspot.com/2022/04/shortcomings-of-ipcc-ar6-wgiii-mitigation-of-climate-change.html

• NOAA Mauna Loa CO₂ annual mean data
https://gml.noaa.gov/ccgg/trends/data.html

• NOAA globaly averaged marine surface annual mean methane data
https://gml.noaa.gov/ccgg/trends_ch4

• Is the IPCC creating false perceptions, again?
https://arctic-news.blogspot.com/2021/08/is-the-ipcc-creating-false-perceptions-again.html

• The shared socio-economic pathway (SSP) greenhouse gas concentrations and their extensions to 2500 - by Malte Meinshausen et al. 
https://gmd.copernicus.org/articles/13/3571/2020

• Clausius–Clapeyron relation

• Heat dome
https://en.wikipedia.org/wiki/Heat_dome

• ESA - Heatwave across India
https://www.esa.int/ESA_Multimedia/Images/2022/04/Heatwave_across_India

• Evaporative Demand Increase Across Lower 48 Means Less Water Supplies, Drier Vegetation, and Higher Fire Risk
https://www.drought.gov/news/evaporative-demand-increase-across-lower-48-means-less-water-supplies

• A Multidataset Assessment of Climatic Drivers and Uncertainties of Recent Trends in Evaporative Demand across the Continental United States - by Christine Albano et al.
https://journals.ametsoc.org/view/journals/hydr/23/4/JHM-D-21-0163.1.xml

• It could be unbearably hot in many places within a few years time
https://arctic-news.blogspot.com/2016/07/it-could-be-unbearably-hot-in-many-places-within-a-few-years-time.html

• The emergence of heat and humidity too severe for human tolerance - by Colin Raymond et al.
https://www.science.org/doi/10.1126/sciadv.aaw1838

• Evaluating the 35°C wet-bulb temperature adaptability threshold for young, healthy subjects (PSU HEAT Project) - by Daniel Vecellio et al.
https://pennstate.pure.elsevier.com/en/publications/evaluating-the-35c-wet-bulb-temperature-adaptability-threshold-fo

• Co-extinctions annihilate planetary life during extreme environmental change, by Giovanni Strona and Corey Bradshaw (2018)
https://www.nature.com/articles/s41598-018-35068-1

• Jet Stream
https://arctic-news.blogspot.com/p/jet-stream.html

• When Will We Die?
https://arctic-news.blogspot.com/2019/06/when-will-we-die.html

• Climate Plan
https://arctic-news.blogspot.com/p/climateplan.html


Saturday, April 16, 2022

Runaway temperature rise by 2026?

March 2022 temperature anomaly

The NASA image below shows the March 2022 temperature anomaly. The Arctic is heating up strongly. 


The above image shows a temperature rise for March 2022 of 1.06°C, which is the rise from 1951-1980. The image below shows a temperature rise from 1900 for March 2022 of 1.36°C. 


[ click on images to enlarge ]
The box on above image shows that, when including further adjustment, the temperature rise from pre-industrial to March 2022 could be as much as 2.35°C. Details of the adjustment are described at the pre-industrial page. A 2.35°C rise is only 0.65°C away from a 3°C rise and, as described before, a 3°C rise will likely drive humans (and many other species) into extinction. 

Note that the March 2022 temperature is suppressed, as we're currently in the depth of a persistent La Niña, as illustrated by the NOAA image on the right. 


[ click on images to enlarge ]
The above NOAA image shows that the difference between the top of El Niño and the bottom of La Niña could be more than half a degree Celsius. The peak of the next El Niño may well coincide with a high number of sunspots (NOAA image right). 

The image below features two trends. The black trend is based on adjusted Jan.1880-Mar.2022 NASA data and shows how 3°C could be crossed in 2027. The blue trend is based on adjusted Apr.2012-Mar.2022 NASA data and better reflects short-term variables such as sunspots and El Niño. The blue trend shows how 3°C could be crossed in 2025, triggered by an emerging El Niño and high sunspots. 


Runaway temperature rise

[ click on images to enlarge ]
A strong El Niño combined with high sunspots could cause the global temperature rise to cross 3°C in 2025.

Moreover, this could trigger runaway temperature rise, starting before 2026 where the temperature rise is felt most strongly, i.e. in the Arctic, especially during El Niño events, as illustrated by the image on the right that shows anomalies (vs 1951-1980) as high as 6.6°C in the Arctic.  


[ see the Extinction page ]
The potential temperature rise is illustrated by the bar on the right.

As temperatures rise, loss of Arctic sea ice and of its latent heat buffer will cause more heating of the atmosphere, while changes to the Jet Stream will cause more extreme weather. 

As humans go extinct, transport and industrial activities will stop that currently co-emit sulfur that masks the full extent of the temperature rise. 

In addition, as also discussed at the aerosols page, worldwide forest fires and trash fires could cause huge amounts of black carbon to be emitted. 

Rising temperatures will result in more water vapor in the atmosphere (7% more water vapor for every 1°C warming), further amplifying the temperature rise, since water vapor is a potent greenhouse gas. 

As the IPCC warns (see above image), for each additional 1°C of warming, the global volume of perennially frozen ground to 3 m below the surface is projected to decrease by about 25% relative to the present volume, and the IPCC adds that these decreases may be underestimates. As permafrost declines, huge amounts of carbon dioxide, methane and nitrous oxide get released. 

As the ocean heats up, a huge temperature rise could be caused by releases of seafloor methane, further contributing to the clouds tipping point (at 1200 ppm CO₂e) to get crossed, causing a further rise of 8°C. Altogether, the temperature rise could exceed 18°C.

The situation is dire and calls for comprehensive and effective action, as described in the Climate Plan.

In the video below, Jennifer Hynes and Sandy Schoelles discuss the temperature rise. 


Links

• NASA Gistemp
https://data.giss.nasa.gov/gistemp

• Pre-industrial
https://arctic-news.blogspot.com/p/pre-industrial.html

• When Will We Die?
https://arctic-news.blogspot.com/2019/06/when-will-we-die.html

• NOAA - Monthly Temperature Anomalies Versus El Niño
https://www.ncei.noaa.gov/access/monitoring/monthly-report/global/202203/supplemental/page-4

• NOAA - ENSO: Recent Evolution, Current Status and Predictions
https://www.cpc.ncep.noaa.gov/products/analysis_monitoring/lanina/enso_evolution-status-fcsts-web.pdf

• NOAA - Solar cycle sunspots progression
https://www.swpc.noaa.gov/products/solar-cycle-progression

• Sunspots
https://arctic-news.blogspot.com/p/sunspots.html

• Extinction
https://arctic-news.blogspot.com/p/extinction.html

• Aerosols
https://arctic-news.blogspot.com/p/aerosols.html

• Arctic Hit By Ten Tipping Points
https://arctic-news.blogspot.com/2020/04/arctic-hit-by-ten-tipping-points.html

• IPCC - FAQ on water vapor
https://wg1.ipcc.ch/publications/wg1-ar4/faq/wg1_faq-3.2.html

• IPCC - AR6 WG1 TS on permafrost
https://www.ipcc.ch/report/ar6/wg1/downloads/report/IPCC_AR6_WGI_TS.pdf

• Clouds feedback
https://arctic-news.blogspot.com/p/clouds-feedback.html

• Climate Plan
https://arctic-news.blogspot.com/p/climateplan.html


Friday, April 8, 2022

Global Warming and the Fermi Paradox

by Andrew Glikson


Enrico Fermi, Physicist, 1901-1953
According to Fermi’s Paradox, the failure to date to achieve radio communication between Earth and extraterrestrial civilizations can be attributed to their inevitable short-term self-destruction, a consequence of uncontrolled dispersion of toxic substances, contamination of air, water and land, and construction of deadly weapons. On Earth this includes saturation of the atmosphere by greenhouse gases and production of nuclear weapons. 

The most extensive mass extinction event in the history of Earth, represented by the Permian-Triassic boundary 251 million years-ago, involved warming, acidification and oxygen depletion of the oceans, with consequent emanations of toxic H₂S and CH₄, leading to a loss of some 57% of biological families, 83% of genera and 81% of marine species.

If the history of the 21st century is ever written it would report that, while large parts of the planet were becoming uninhabitable, the extreme rate and scale of global warming and the migration of climate zones (~100 km per decade), the extent of polar ice melting, ocean warming and acidification, and methane release from permafrost, threatened to develop into one of the most extensive mass extinction events in the geological history of planet Earth.

As concentrations of atmospheric greenhouse gases exceed 500 ppm CO₂-equivalents, consistent with global warming of more than >4°C (image above right), driving temperatures to well above 4°C (image below) and threatening to rise at a higher rate than those of the great mass extinctions. 

The accelerating destruction of the liveable Earth atmosphere and oceans (after Wil Steffen, 2012)

Climate scientists have been either silenced or replaced by an army of economists and politicians mostly ignorant of the physics and chemistry of the atmosphere, but quantifying the cost-benefit economies of mitigation like corner shop grocers.

James Hansen giving testimony
before the U.S. Congress (1988)
Proposed mitigation action were mostly focused on reduction of emissions, neglecting the amplifying feedbacks and tipping points projected by leading climate scientists such as James Hansen (image right).

But climate change was not the only threat hanging over the head of humanity and nature. As nations kept proliferating atomic weapons, with time the probability of a nuclear war increased exponentially. 

At the root of the MAD (mutual assured destruction) policy, or omnicide, resides the deep tribalism and herd mentality of the species, hinging on race, religion, ideology, territorial claims and the concept of an “enemy” perpetrated by demagogues and warmongers, leading to an Orwellian 1984 world where “Oceania has always been at war with East-Asia”, as in the current “forever wars“. Prior to World War I two social forces collided, fascism and socialism. While the former has changed appearances, the latter weakened. At the core of superpower conflict between the Anglo-Saxon world and the Slavic or Chinese worlds are claims of moral superiority, but in reality naked grabs for power.

At the centre of human conscience is its mythological nature, a mindset closely related to the mastery of fire where, for longer than one million years, Homo erectus, perched at campfire, watching the flickering flames, has grown its insights and imagination, developing a fear of death, dreaming of omniscience and omnipotence, aspiring for eternal life.

As civilization developed in the Neolithic these sentiments drove humans to construct pyramids to enshrine immortality, undertake human sacrifice, to perpetrate death to appease the gods, expressed in modern times through world wars, as stated by Albert Einstein: “The splitting of the atom has changed everything bar man’s way of thinking and thus we drift into unparalleled catastrophes”.

For an intelligent species to be able to explore the solar system planets but fail to protect its own home planet defies explanation. For a species to magnify its entropic effect on nature by orders of magnitude, developing cerebral powers which allow it to become the intelligent eyes through which the Universe explores itself, hints at yet unknown natural laws which underlie life, consciousness and complexity.

We have entered the age of consequences, masked by the 24 hours news cycle that can only portray transient events but rarely exposes the Orwellian misconceptions which underlie the complicity of the powers-that-be. For, just as individuals can be plagued by insanity, so can groups of people, as in the Jonestown massacre, or in Nazi Germany, where a nation or a species slide blindly into mass suicide, creating systems that saturate the atmosphere with carbon gases and proliferate nuclear weapons in a terrestrial confirmation of Fermi’s Paradox.


Andrew Glikson
A/Prof. Andrew Glikson

Earth and Paleo-climate scientist
School of Biological, Earth and Environmental Sciences
The University of New South Wales,
Kensington NSW 2052 Australia


Books:
The Asteroid Impact Connection of Planetary Evolution
https://www.springer.com/gp/book/9789400763272
The Archaean: Geological and Geochemical Windows into the Early Earth
https://www.springer.com/gp/book/9783319079073
Climate, Fire and Human Evolution: The Deep Time Dimensions of the Anthropocene
https://www.springer.com/gp/book/9783319225111
The Plutocene: Blueprints for a Post-Anthropocene Greenhouse Earth
https://www.springer.com/gp/book/9783319572369
Evolution of the Atmosphere, Fire and the Anthropocene Climate Event Horizon
https://www.springer.com/gp/book/9789400773318
From Stars to Brains: Milestones in the Planetary Evolution of Life and Intelligence
https://www.springer.com/us/book/9783030106027
Asteroids Impacts, Crustal Evolution and Related Mineral Systems with Special Reference to Australia
https://www.springer.com/us/book/9783319745442
The Event Horizon: Homo Prometheus and the Climate Catastrophe
https://www.springer.com/gp/book/9783030547332
The Fatal Species: From Warlike Primates to Planetary Mass Extinction
https://www.springer.com/gp/book/9783030754679


Tuesday, April 5, 2022

Shortcomings of IPCC AR6 WGIII - Mitigation of Climate Change

In the video below, U.N. Secretary-General António Guterres comments on the launch of the IPCC AR6 WGIII SPM Mitigation report. 

[ U.N. Secretary-General António Guterres ]

The report has severe shortcomings, including: 

The IPCC makes it look as if the temperature rise could be restricted to 1.5°C above pre-industrial and insists there was a carbon budget left, to be divided by using monetary analysis. 

This narrative results in a failure to highlight in the SPM some key drivers of change (such as heat pumps in buildings and air taxis in transport) and in inappropriately referring to such key drivers of change as 'options', while failing to mention the best policies to achieve the necessary changes, i.e. through local feebates.


The agenda behind this narrative becomes further evident in phrases such as “CCS could allow fossil fuels to be used longer, reducing stranded assets” and “oil and gas assets are projected to be more at risk of being stranded toward mid-century”. 


Instead of “assets” at “risk” of getting “stranded”, these are liabilities that burden the world with a rising cost of clean-up and compensation claims. The IPCC gives CCS further undeserved importance by mentioning it no less than 32 times in the SPM, while a key driver of change such as heat pumps is mentioned only once, and not under buildings but industrial policy. 

The image below, from the report's SPM, shows “options” by sector with the length of each bar indicating their potential for emissions reduction by 2030, while the color inside the bar gives a cost estimate. 

[ from IPCC AR6 WGIII SPM, click images to enlarge ]

These are not genuinely options, since the dire situation leaves little choice and instead makes it imperative to act most urgently, comprehensively and effectively on climate change, in line with the Paris Agreement. 


The Paris Agreement does instruct the IPCC to describe the best pathways to achieve this and the IPCC has until now refused to do so. As Arctic-news blog has pointed out for more than a decade, mitigation is most effectively achieved by offering people a range of options, preferably through local feebates, which will also make such policies more popular, as a 2019 analysis (above) concludes.

[ from earlier post ]

Options are more appropriately realized in the form of feebates that can offer a range of options, with the more polluting options attracting fees and with the revenues used to fund rebates on the cleaner options. 

An example of a wider set of local feebates is depicted in the above analysis of EV policy. A more diverse set of feebates could include not only fees on fuel and fuel-powered vehicles, but also on facilities that sell or process fuel, vehicle registration, parking, toll roads, etc. It's important to act comprehensively, along several lines of action, e.g. to redesign cities and plan for air taxis

Given the urgency to act, such lines of action are all best implemented as soon as possible, yet at the same time many lines of action are best kept separate, as illustrated by the above image. 

The image on the right illustrates the difference between using a Gobal Warming Potential (GWP) for methane of 171 over a few years, vs the IPCC's use of a GWP of 28 over 100 years. 


Fees on sales of livestock products can raise revenue for pyrolysis of biowaste, with the resulting biochar added to the soil.  That would also support the transition toward a vegan-organic diet more strongly, in line with the conclusion of an earlier IPCC report that a vegan diet ranks highest regarding mitigation (image right, from an earlier post). 

The Climate Plan prefers local feebates. Where needed, fees can be set high enough to effectively ban specific alternatives.

Furthermore, instead of using money, local councils could add extra fees to rates for land where soil carbon falls, while using all revenue for rebates on rates for land where soil carbon rises.

That way, biochar effectively becomes a tool to lower rates, while it will also help improve the soil's fertility, its ability to retain water and to support more vegetation. That way, real assets are built, as illustrated by the image on the right, from the 2014 post Biochar Builds Real Assets.

Catastrophic Methane Rise 

The IPCC narrative hinges on radical cuts in methane emissions from 2020, as illustrated by the image on the right. 

Instead, methane rose by 15.27 ppb in 2020 and by 16.99 ppb in 2021, the two highest growth levels since the NOAA record began in 1984. 

The combination image below shows the catastrophic rise of methane. The image in the left panel shows a trend based on January 2008-December 2021 monthly mean methane data. 

When extending this trend, current methane concentration would be 1920 ppb. Note that methane in December 2021 was 18.6 ppb higher than in December 2020, and it now is April 2022.


The situation is even worse than depicted in above image, as NOAA's data are for marine surface measurements. Methane tends to rise in the atmosphere and accumulate at higher altitudes. As illustrated by the image below, mean methane level is growing fastest at the higher altitude associated with 293 mb. 


Anyway, have another look at the combination image further above. The right panel shows that, if the trend continues, a concentration of 3840 ppb (i.e. double the current concentration) could be crossed in 2029, which would translate into a carbon dioxide equivalent (CO₂e) of 768 parts per million (ppm) at a one-year global warming potential (GWP) for methane of 200

The image on the right shows a trend that, if continued, will cross a carbon dioxide level of 450 ppm by 2029. 

Add this 450 ppm for CO₂ to 768 ppm CO₂e for methane and the joint CO₂e could be 1218 ppm in 2029, i.e. it would have crossed the point at which the clouds feedback starts to kick in (at 1200 ppm CO₂e). 

The clouds feedback could thus raise the global temperature by 8°C by 2029, but when also adding the temperature impact of greenhouse gases and further drivers, the clouds tipping point could be crossed much earlier, say by 2026, while a temperature rise of 10°C could happen even before the clouds tipping point gets reached. Drivers could include nitrous oxide (N₂O, see image right), seafloor methane, water vapor, loss of Arctic sea ice and the falling away of the aerosol masking effect, as discussed at the Extinction page.

The situation is dire and calls for comprehensive and effective action, as described in the Climate Plan.

Links


• Secretary-General Warns of Climate Emergency, Calling Intergovernmental Panel’s Report ‘a File of Shame’, While Saying Leaders ‘Are Lying’, Fuelling Flames
https://www.un.org/press/en/2022/sgsm21228.doc.htm

• Mitigation of Climate Change Report 2022: "Litany of broken climate promises" - UN Chief
https://www.youtube.com/watch?v=P8rlLaT8v4Q

• IPCC Climate Change 2022 - Mitigation of Climate Change - Summary for Policymakers
https://report.ipcc.ch/ar6wg3/pdf/IPCC_AR6_WGIII_SummaryForPolicymakers.pdf

• IPCC special report Climate Change and Land
https://www.ipcc.ch/report/srccl

• IPCC Report Climate Change and Land (review)
• Which policy can help EVs most?
https://arctic-news.blogspot.com/2019/10/which-policy-can-help-evs-most.html

• Confirm Methane's Importance
https://arctic-news.blogspot.com/2021/03/confirm-methanes-importance.html

• Biochar Builds Real Assets

• The Importance of Methane

• NOAA - Globally averaged marine surface monthly mean methane data
https://gml.noaa.gov/webdata/ccgg/trends/ch4/ch4_mm_gl.txt

• NOAA - Globally averaged marine surface annual mean methane data

• NOAA - MetOp satellite methane data - Infrared Atmospheric Sounding Interferometer (IASI)

• NOAA - Mauna Loa CO2 weekly mean and historical comparisons

• Clouds feedback

• Extinction