Keep in mind that this 1900.5 ppb reading is for September 2021; it now is January 2022. Furthermore, NOAA's data are for marine surface measurements; more methane tends to accumulate at higher altitudes, and especially at higher latitudes North, as also illustrated by the images further below.
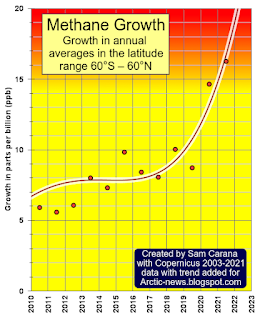
The image on the right shows the Copernicus data for methane growth with an added trend that ominously points at a growth rate for 2022 that could be more than 20%.
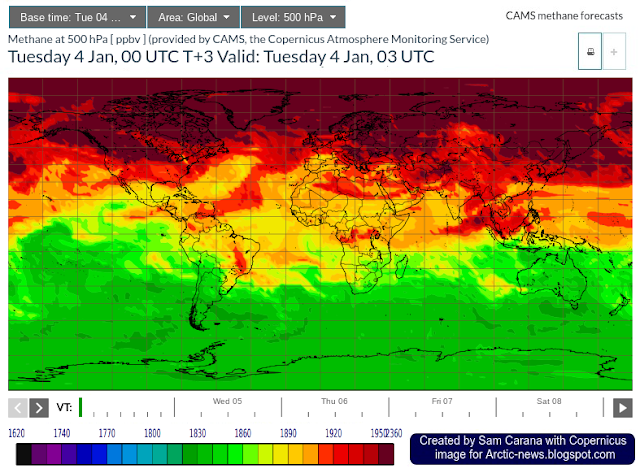
Very high greenhouse gas levels continue to show up over the Arctic. The image below, created with a Copernicus forecast for January 4, 2022, 03 UTC, shows methane at 500 hPa.
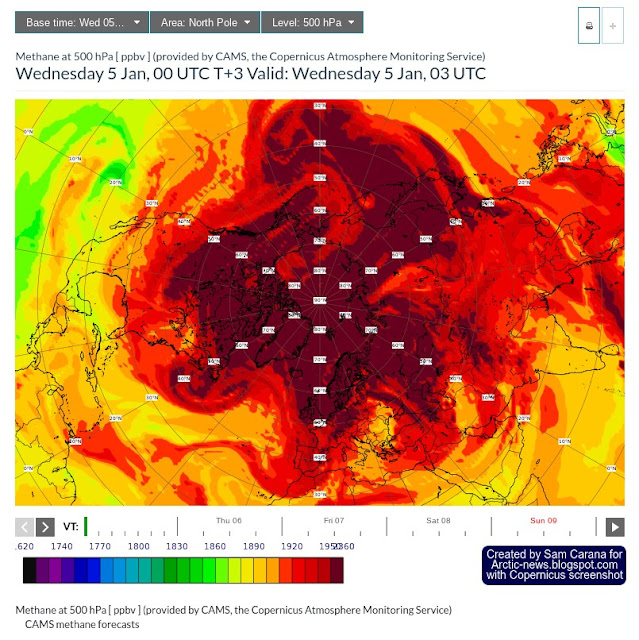
The image further down below is a screenshot of a Copernicus forecast for January 5, 2022, 03 UTC, again showing methane at 500 hPa, but this time using a North Pole projection.
The darkest-brown color on the scale for 500 hPa on the Copernicus images (above and below) indicates methane concentrations of 1950 ppb and higher.
While the Copernicus images show well that such concentrations (of 1950 ppb and higher) dominate over the Arctic at 500 hPa, the scales used by Copernicus have upper limits of 2300 ppb (300 hPa), 2360 (500 hPa) and 2320 (total column) which could give the false impression that higher concentrations did not occur at higher altitudes.
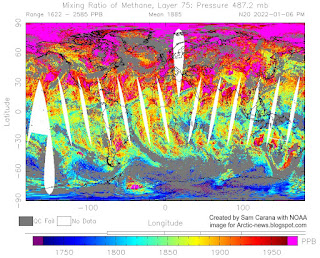
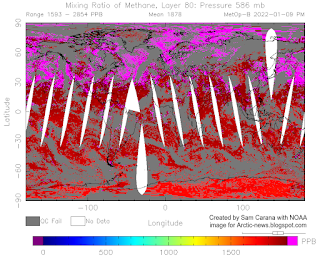
Higher methane concentrations do actually occur at around 500 hPa, as the images on the right illustrate. Such high peaks are important as they could be caused by abrupt methane releases rising in plumes from the seafloor of the Arctic Ocean.
The N20 satellite image on the right that shows concentrations of up to 2585 ppb at 487.2 mb (equivalent to 487.2 hPa) on January 6, 2022.
An earlier example is a MetOp satellite reading of up to 2861 ppb at 469 mb on December 31, 2021.
Further examples are readings of up to 2852 ppb at 506 mb and up to 3644 ppb at 367 mb on November 21, 2021, pm.
The image below is a screenshot of a Copernicus forecast for January 5, 2022, 03 UTC, this time showing methane at surface level and using a Eurasia projection. Note that the darkest-brown color on the scale for surface level indicates methane concentrations above 2160 parts per billion (ppb).
The image below is a forecast for January 9, 2022, 03 UTC, run January 9, 2022, 00 UTC. The scale for this image goes up to 24840 ppb. That doesn't necessarily mean that concentrations are forecast to be as high as that; Copernicus has simply fixed the top end of the scale for 850 hPa at 24840 ppb.
For its surface forecasts, Copernicus appears to use a combination of models and observations, with an emphasis on extrapolating from in situ measurements, which can ignore methane releases from locations where such in situ measurements are lacking, particularly over the Arctic Ocean. By contrast, the animation below of December 31, 2021 am, polar-orbiting MetOp satellite images, from an earlier post, shows the highest methane concentrations first emerging over water at higher latitudes North, rather than over land.
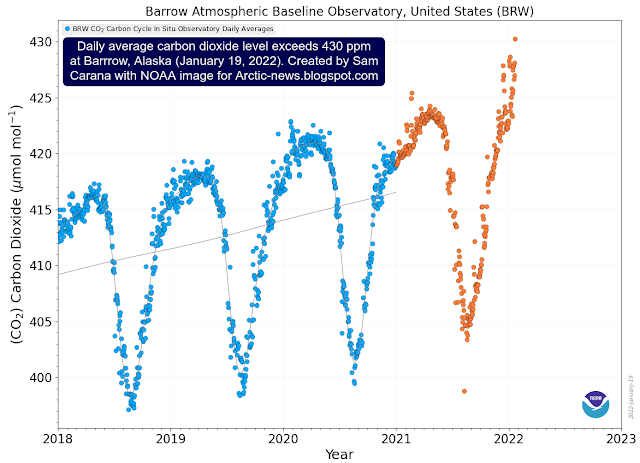
Furthermore, carbon dioxide levels also continue to be very high at Barrow, Alaska, as illustrated by the image below, showing a recent daily average exceeding 430 ppm.
Locally, CO₂ concentration can be even higher. The image below shows a concentration of 440 ppm over the Arctic Ocean at the green circle, as the jet stream crosses the Arctic on January 19, 2022.
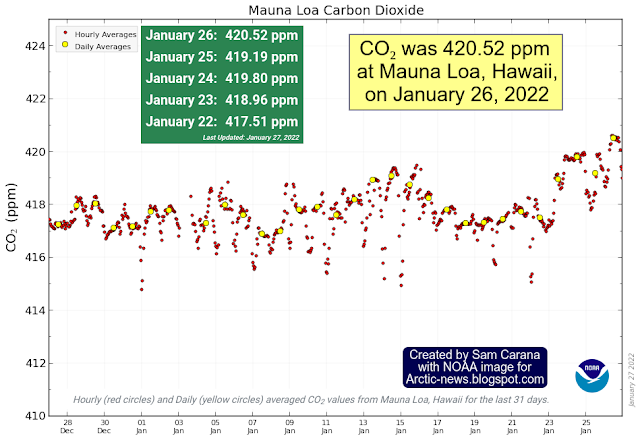
CO₂ concentration at Mauna Loa was 420.52 ppm on January 26, 2022. The annual peak for CO₂ is expected to occur about May 2022, so it will still go up a lot higher than this over the next few months.
Now add an additional 5 Gt of methane from an abrupt eruption of the seafloor, which is only 10% of the 50 Gt that Natalia Shakhova et al. warned about long ago, while 50 Gt is in turn only a small fraction of all the methane contained in sediments in the Arctic. On its own, such an eruption of seafloor methane could raise the global mean methane concentration by almost 2000 ppb which, at a 1-year GWP of 200, would translate into 400 ppm CO₂.
So, that would abruptly cause the joint CO₂e of just two greenhouse gases, i.e. methane and CO₂, to cross the 1200 ppm clouds tipping point, triggering a further 8°C global temperature rise, due to the clouds feedback.
The situation is dire and calls for the most comprehensive and effective action, as described at the Climate Plan.
Links
• NOAA - globally averaged marine surface monthly mean methane data
https://gml.noaa.gov/webdata/ccgg/trends/ch4/ch4_mm_gl.txt
• NOAA - globally averaged marine surface annual mean methane growth rates
The image below is a forecast for January 9, 2022, 03 UTC, run January 9, 2022, 00 UTC. The scale for this image goes up to 24840 ppb. That doesn't necessarily mean that concentrations are forecast to be as high as that; Copernicus has simply fixed the top end of the scale for 850 hPa at 24840 ppb.
Clearly, some very high methane concentrations are showing up over the Arctic. The image below shows monthly average in situ methane measurements recorded at Barrow, Alaska, with high averages showing up for recent months.
Locally, CO₂ concentration can be even higher. The image below shows a concentration of 440 ppm over the Arctic Ocean at the green circle, as the jet stream crosses the Arctic on January 19, 2022.
Why again is this growth in methane so terrifying?
The danger is that these high concentrations of greenhouse gases over the Arctic will contribute to high temperature anomalies in the Arctic and result in further decline of the snow and ice cover and associated changes to the Jet Stream, causing abrupt methane releases from submarine sediments containing hydrates and chambers of free gas.
The MetOp-B satellite recorded a mean methane level of 1958 ppb on October 25, 2021 am at 295 mb, and when using a 1-year GWP of 200, this translates into 391.6 ppm CO₂e. Together with the above CO₂, that's 391.6 + 420.52 = 812.12 ppm CO₂e.
So, that would abruptly cause the joint CO₂e of just two greenhouse gases, i.e. methane and CO₂, to cross the 1200 ppm clouds tipping point, triggering a further 8°C global temperature rise, due to the clouds feedback.
The situation is dire and calls for the most comprehensive and effective action, as described at the Climate Plan.
Links
• NOAA - globally averaged marine surface monthly mean methane data
https://gml.noaa.gov/webdata/ccgg/trends/ch4/ch4_mm_gl.txt
• Copernicus news release
• Terrifying Arctic methane levels
https://arctic-news.blogspot.com/2021/12/terrifying-arctic-methane-levels.html
• NOAA - Infrared Atmospheric Sounding Interferometer (IASI) Sounding Products (MetOp)
https://www.ospo.noaa.gov/Products/atmosphere/soundings/iasi
• CAMS, the Copernicus Atmosphere Monitoring Service
https://atmosphere.copernicus.eu/charts/cams
• NOAA - Carbon Cycle Gases, Barrow Atmospheric Baseline Observatory, United States
https://gml.noaa.gov/dv/iadv/graph.php?code=BRW
• NOAA - Trends in Atmospheric Carbon Dioxide, Mauna Loa, Hawaii
https://gml.noaa.gov/ccgg/trends/graph.html
• Human Extinction by 2022?
https://arctic-news.blogspot.com/2021/11/human-extinction-by-2022.html
• Climate Plan
https://arctic-news.blogspot.com/p/climateplan.html


