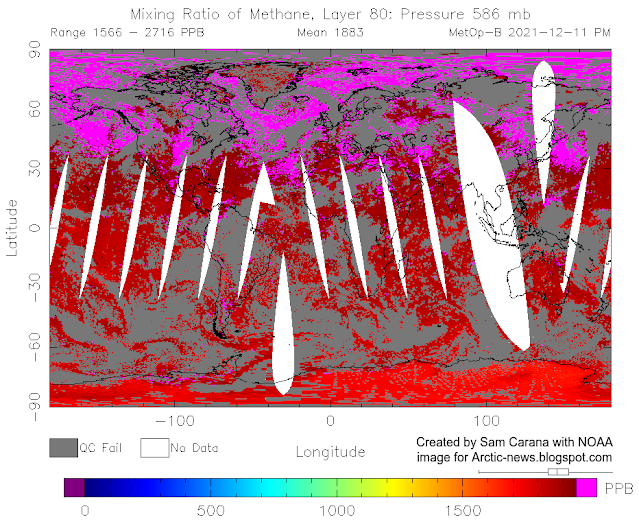
A peak methane level of 3026 ppb was recorded by the MetOp-B satellite at 469 mb on December 11, 2021 am.
This follows a peak methane level of 3644 ppb recorded by the MetOp-B satellite at 367 mb on November 21, 2021, pm.
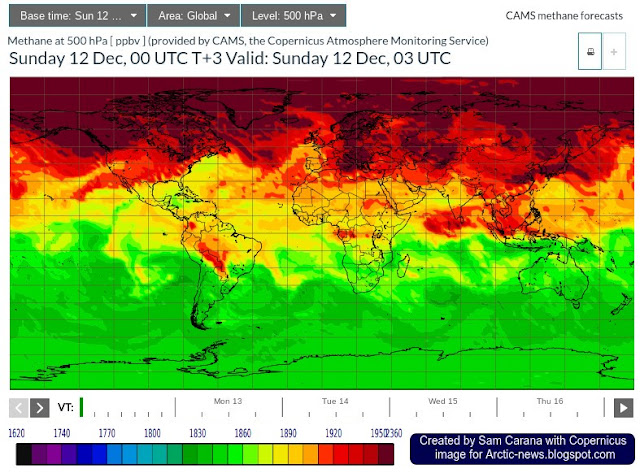
Also, the image was recorded later than the image at the top with the 3026 ppb peak, indicating that even more methane may be on the way. This appears to be confirmed by the Copernicus forecast for December 12, 2021, 03 UTC, as illustrated by the image below, which shows methane at 500 hPa (equivalent to 500 mb).
Furthermore, very high methane levels have recently been recorded at Barrow, Alaska, as illustrated by the image below, showing monthly averages.
And carbon dioxide levels have also been very high recently at Barrow, Alaska, as illustrated by the image below, showing daily averages.
What causes these terrifying methane levels?
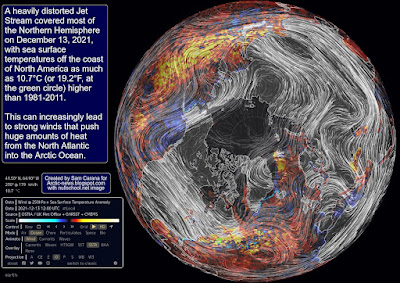
As the combination image below shows, the sea surface temperature north of Svalbard was as high as 4.3°C (or 39.74°F, green circle in the left panel) on December 12, 2021, i.e. as much as 5°C (or 9°F, green circle in the right panel) higher than 1981-2011.
 |
| [ click on images to enlarge ] |
At times, this can lead to very strong winds that push huge amounts of heat from the North Atlantic into the Arctic Ocean.
The image on the right is a forecast for December 14, 2021, showing strong wind causing waves as high as 8.3 m (or 27.2 ft) off the coast of Norway, speeding up the flow of warm water as it dives underneath the sea ice north of Svalbard.
Huge amounts of heat can thus move into the Arctic Ocean, driven by ocean currents and temperature differences.
Huge amounts of heat can thus move into the Arctic Ocean, driven by ocean currents and temperature differences.
The danger is that warmer water will cause methane to erupt from the seafloor of the Arctic Ocean, as an earlier post warned.
 |
| [ The buffer is gone, from earlier post ] |
Sea ice used to act as a buffer, by consuming energy in the process of melting, thus avoiding that this energy could raise the temperature of the water of the Arctic Ocean. As above image indicates, the buffer has now virtually disappeared.
As sea ice gets thinner, ever less sea ice can act as a buffer. This is also illustrated by the 30-day navy.mil animation (up to November 12, the last 8 days are forecasts) on the right, from an earlier post.
Furthermore, huge amounts of heat did get transferred to the atmosphere over the Arctic Ocean, while and as long as sea ice was low in extent.
The image on the right, also from that earlier post, shows the October 2021 temperature anomaly, with anomalies over the Arctic showing up of as much as 9.1°C.
As the sea ice animation also shows, lower air temperatures after September caused the sea ice to grow in extent, effectively sealing off the Arctic Ocean and reducing heat transfer from the Arctic Ocean to the atmosphere.
Heat that was previously melting the ice or that was getting transferred to the atmosphere is now instead heating up the water. Some 75% of ESAS (East Siberian Arctic Shelf) is shallower than 50 m. Being shallow, these waters can easily warm up all the way down to the sea floor, where heat can penetrate cracks and conduits, destabilizing methane hydrates and sediments that were until now sealing off methane held in chambers in the form of free gas in these sediments.
Sealed off from the atmosphere by sea ice, greater mixing of heat in the water will occur down to the seafloor of the Arctic Ocean.
 |
| [ From the post September 2015 Sea Surface Warmest On Record ] |
Also, as land around the Arctic Ocean freezes over, less fresh water will flow from rivers into the Arctic Ocean. As a result, the salt content of the Arctic Ocean increases, all the way down to the seafloor of the Arctic Ocean, making it easier for ice in cracks and passages in sediments at the seafloor to melt, allowing methane contained in the sediment to escape. Meanwhile, salty and warm water (i.e. warmer than water that is present in the Arctic Ocean) keeps getting carried along the track of the Gulf Stream into the Arctic Ocean.
The threat
 |
| [ The Buffer has gone, feedback #14 on the Feedbacks page ] |
 |
This process threatens to result in ever more methane getting released, as illustrated in the image on the right, from an earlier post.
In other words, the current global mean of methane is now above 1900 ppb. Given that methane's concentration is rising at accelerating pace (see image right), the implication is that in an expanding troposphere, the volume of methane and thus its greenhouse effect will be rising even faster.
A study published November 2021 in Science Advances finds a continuous rise of the tropopause in the Northern Hemisphere over 1980–2020, resulting primarily from tropospheric warming.
As illustrated by the image below, methane on December 26 am, 2021, reached a global mean of 1939 ppb between 293 mb and 280 mb, while the highest peak level (2554 ppb) was reached higher in the atmosphere, at 218 mb.
 |
| [ click on images to enlarge ] |
The CO₂ level at Mauna Loa was 415.87 ppm on December 9, 2021. The MetOp-B satellite recorded a mean methane level of 1958 ppb on October 25, 2021 am at 295 mb, and when using a 1-year GWP of 200, this translates into 391.6 ppm CO₂e. Together, that's 391.6 + 415.87 = 807.47 ppm CO₂e.
Now add an additional 5 Gt of methane from an abrupt eruption of the seafloor, which is only 10% of the 50Gt that Natalia Shakhova et al. warned about long ago, while 50 Gt is in turn only a small fraction of all the methane contained in sediments in the Arctic. Such an eruption of seafloor methane would raise the global mean methane concentration by almost 2000 ppb which, at a 1-year GWP of 200, would translate into 400 ppm CO₂.
So, that would abruptly cause the joint CO₂e of methane and CO₂ to cross the 1200 ppm clouds tipping point, triggering a further 8°C global temperature rise, due to the clouds feedback.
A 5 Gt seafloor methane burst would double the methane in the atmosphere and could instantly raise CO₂e level to above 1200 ppm, thus triggering the cloud feedback (panel top right). Even with far less methane, levels of further pollutants could rise and feedbacks could strengthen, while sulfate cooling could end, and a 18.44°C rise (from pre-industrial) could occur by 2026 (left panel). Meanwhile, humans will likely go extinct with a 3°C rise, and a 5°C rise will likely end most life on Earth.
Conclusion
The situation is dire and calls for the most comprehensive and effective action, as described at the Climate Plan.
Links
• CAMS, the Copernicus Atmosphere Monitoring Service
https://atmosphere.copernicus.eu/charts/cams
• Nullschool.net
• NASA temperature
https://arctic-news.blogspot.com/2017/04/the-methane-threat.html
• High methane levels over the Arctic Ocean on January 14, 2014
• The Importance of Methane
• Will COP26 in Glasgow deliver?
• When Will We Die?
• NOAA mean global monthly methane
• SCRIPPS - The Keeling Curve
• Continuous rise of the tropopause in the Northern Hemisphere over 1980–2020 - by Lingyun Meng et al.
• Frequently Asked Questions
• Climate Plan
https://arctic-news.blogspot.com/p/climateplan.html
https://arctic-news.blogspot.com/p/climateplan.html


