How can the problems of war, climate collapse and famine best be addressed?
How can these problems best be addressed? For more than two decades, two sets of feebates have been recommended to help achieve agriculture reform and a rapid transition to clean, renewable energy, as depicted in the images in this post and as discussed in many earlier posts and the text below.

Agricultural Reform
Agriculture uses half of habitable land. Agriculture uses 70% to 90% of the freshwater supply. Most farmland is used to produce meat and diary. A 2019 Greenpeace analysis found over 71% of EU farmland to be dedicated to meat and dairy. Much agricultural land is used unsustainably in many ways; there is growing dependence on chemical fertilizers and weedkillers & herbicides, fungicides, insecticides, rodenticides and other pesticides; there is also a growing dependency on fossil fuel in many agricultural and food-related activities; and there is a growing demand for water. This causes huge emissions of greenhouse gases, pollution with toxic compounds, depletion of groundwater, salinification and erosion of soil and loss of soil nutrients and soil carbon content, and loss of diversity of many of the plants, the wildlife and the microorganisms that helped the world population grow to 8 billion people.

Changing from food that is rich in meat and dairy to vegan-organic food can free up large areas of land that can instead be used for other purposes such as community gardens and food forests. It can bring down the cost of food and it can, in combination with biochar, restore the soil's carbon, moisture and nutrients content.
Instead of adding chemical nitrogen fertilizers - typically produced with natural gas - in annually-planted monocultures, it's better to have a diversity of vegetation including a variety of perennial plants such as legumes and trees. Furthermore, pyrolyzing biowaste should be encouraged, as this reduces fire hazards and produces biochar that can be added to soil to sequester carbon and to increase nutrients and moisture in the soil. According to Schmidt et al., 400,000 pyrolysis plants need to be built to process 3.8 billion tons of biowaste annually.

Local councils could encourage this by adding extra fees to rates for land where soil carbon falls, while using the revenue for rebates on rates for land where soil carbon rises.
The contribution of agriculture to emissions of carbon dioxide and especially methane is huge. The image on the right illustrates the difference between using a Gobal Warming Potential (GWP) for methane of 171 over a few years versus 28 over 100 years.
Nitrous oxide is also important, as a potent greenhouse gas and also as an ozone depleting substance (ODS). The impact of nitrous oxide as an ODS has grown relative to the impact of CFCs, as the abundance of nitrous oxide has kept rising in the atmosphere.
The IPCC in AR6 gives nitrous oxide a lifetime of 109 years and a GWP of 273. A 2017 study warns about increased nitrous oxide emissions from Arctic peatlands after permafrost thaw.
Furthermore, a recent study finds that nitrous oxide emissions contribute strongly to cirrus clouds, especially when ammonia, nitric acid and sulfuric acid are present together. Cirrus clouds exerts a net positive radiative forcing of about 5 W m⁻², according to IPCC AR6.
Much of current nitrous oxide emissions is caused by nitrogen fertilizers. Legumes include beans, peas, peanuts, lentils, lupins, mesquite, carob, tamarind, alfalfa, and clover. Legumes can naturally fix nitrogen to the soil, thus reducing the need for nitrogen fertilizer and in turn reducing the associated emissions, including emissions of methane and nitrous oxide.
Adding nitrogen fertilizer can also cause the formation of dead zones in lakes and oceans. Dead zones occur when the water gets too many nutrients, such as phosphorus and nitrogen from fertilizers, resulting in oxygen depletion at the top layer of oceans, which can also increase nitrous oxide releases.
In the video on the right, Jim McHenry discusses ways to improve the situation.
All too often, chemical nitrogen fertilizers are added unnecessarily. The intent may be to help the plants grow, e.g. when leaves of plants turn yellow or when there is little growth. But it may actually be that the plants get too little water because the roots of the plants were damaged or too short, or that there was too little shade and too much sun. Excessive nitrogen fertilization and irrigation can then result in a lot of green leaves, but this growth can come at the expense of good food.
Instead, with a good mix of vegetation, there's little or no need to add chemical nitrogen fertilizer, since nitrogen-fixing plants such as legumes can help fast-growing plants get the necessary nitrogen, while the fast-growing plants provide shade for the legumes and the soil. Next to providing shade, the tall, sturdy stalks of plants such as corn can give the vines of beans something to attach themselves to. Fast-growing pants can provide a lot of shade to other plants and to the soil, thus keeping the soil moist, while also preventing the infiltration and growth of weeds and while also deterring pests with their spiny leaves.
Trees can lower surface temperatures by providing shade and by holding colder air under their canopy, thus avoiding extreme temperatures that could also cause the soil to get too dry. The roots of trees prevent erosion and guide rainwater to reach greater depth, thus avoiding that the soil gets too wet in case of heavy rain. Trees then pump water up from deep in the ground with their roots and much of the water comes out again through leaves (evapotranspiration), which stimulates rainfall. Furthermore, trees release pheromones (that attract pollinators) and other aerosols such as terpenes. Trees are typically narrower at the top and wider below, and through their shape and by standing up high they can guide the wind upward, while water vapor released from leaves also helps lift these aerosols into the air. Raindrops forming around these aerosols will further stimulate the formation of lower cloud decks that provide shade, that reflect sunlight back into space and that produce more rainfall locally.
Furthermore, olivine sand can be used to create borders for gardens, footpaths and bicycle paths. Where needed, olivine sand could also be added on top of biochar, as the light color of olivine sand reflects more sunlight, while olivine can also soak up excess water and sequester carbon, while adding nutrients to the soil. By redesigning urban areas, more space can be used for trees, which also reduces the urban heat island effect and thus lowers temperatures.
In the video below, Paul Beckwith discusses global food shortages.
That way, adding biochar effectively becomes a tool to lower rates, while it will also help improve the soil's fertility, its ability to retain water and to support more vegetation. That way, real assets are built, as illustrated by the image on the right, from the 2014 post Biochar Builds Real Assets.
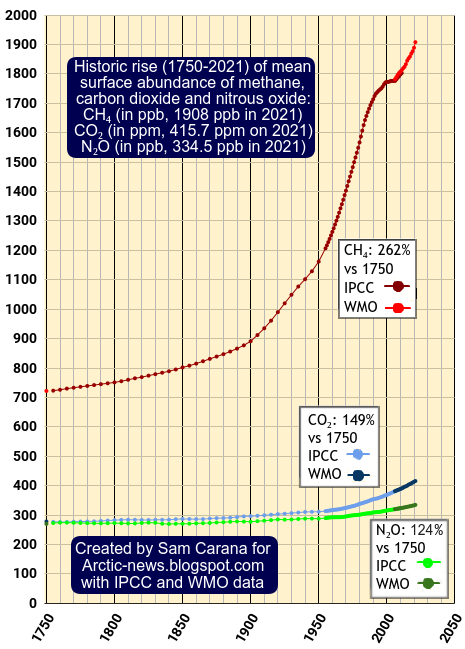
Two sets of feebates can strongly reduce the greenhouse gases in the atmosphere, specifically carbon dioxide (C₂O), methane (CH₄) and nitrous oxide (N₂O).
 |
| [ from earlier post ] |
Nitrous oxide is also important, as a potent greenhouse gas and also as an ozone depleting substance (ODS). The impact of nitrous oxide as an ODS has grown relative to the impact of CFCs, as the abundance of nitrous oxide has kept rising in the atmosphere.
The IPCC in AR6 gives nitrous oxide a lifetime of 109 years and a GWP of 273. A 2017 study warns about increased nitrous oxide emissions from Arctic peatlands after permafrost thaw.
Furthermore, a recent study finds that nitrous oxide emissions contribute strongly to cirrus clouds, especially when ammonia, nitric acid and sulfuric acid are present together. Cirrus clouds exerts a net positive radiative forcing of about 5 W m⁻², according to IPCC AR6.
Adding nitrogen fertilizer can also cause the formation of dead zones in lakes and oceans. Dead zones occur when the water gets too many nutrients, such as phosphorus and nitrogen from fertilizers, resulting in oxygen depletion at the top layer of oceans, which can also increase nitrous oxide releases.
In the video on the right, Jim McHenry discusses ways to improve the situation.
All too often, chemical nitrogen fertilizers are added unnecessarily. The intent may be to help the plants grow, e.g. when leaves of plants turn yellow or when there is little growth. But it may actually be that the plants get too little water because the roots of the plants were damaged or too short, or that there was too little shade and too much sun. Excessive nitrogen fertilization and irrigation can then result in a lot of green leaves, but this growth can come at the expense of good food.
Instead, with a good mix of vegetation, there's little or no need to add chemical nitrogen fertilizer, since nitrogen-fixing plants such as legumes can help fast-growing plants get the necessary nitrogen, while the fast-growing plants provide shade for the legumes and the soil. Next to providing shade, the tall, sturdy stalks of plants such as corn can give the vines of beans something to attach themselves to. Fast-growing pants can provide a lot of shade to other plants and to the soil, thus keeping the soil moist, while also preventing the infiltration and growth of weeds and while also deterring pests with their spiny leaves.
Trees can lower surface temperatures by providing shade and by holding colder air under their canopy, thus avoiding extreme temperatures that could also cause the soil to get too dry. The roots of trees prevent erosion and guide rainwater to reach greater depth, thus avoiding that the soil gets too wet in case of heavy rain. Trees then pump water up from deep in the ground with their roots and much of the water comes out again through leaves (evapotranspiration), which stimulates rainfall. Furthermore, trees release pheromones (that attract pollinators) and other aerosols such as terpenes. Trees are typically narrower at the top and wider below, and through their shape and by standing up high they can guide the wind upward, while water vapor released from leaves also helps lift these aerosols into the air. Raindrops forming around these aerosols will further stimulate the formation of lower cloud decks that provide shade, that reflect sunlight back into space and that produce more rainfall locally.
Furthermore, olivine sand can be used to create borders for gardens, footpaths and bicycle paths. Where needed, olivine sand could also be added on top of biochar, as the light color of olivine sand reflects more sunlight, while olivine can also soak up excess water and sequester carbon, while adding nutrients to the soil. By redesigning urban areas, more space can be used for trees, which also reduces the urban heat island effect and thus lowers temperatures.
In the video below, Paul Beckwith discusses global food shortages.
Also important is the transition to a vegan-organic diet. This can dramatically reduce the need for land and water, while additionally reducing greenhouse gas emissions. A good mix and variety of vegetation can help each of the plants through symbiotic interaction grow an abundance of vegan-organic food locally in a sustainable way.
Pyrolysis of biowaste is recommended as this can turn most carbon into biochar, resulting in high carbon sequestration rates, and increased capacity of the soil to retain carbon, nutrients and moisture, thus reducing erosion, fire hazards and greenhouse gas emissions, while increasing vegetation growth resulting in additional drawdown of carbon from the atmosphere.
Reducing the Cost of Energy and the Cost of Conflict
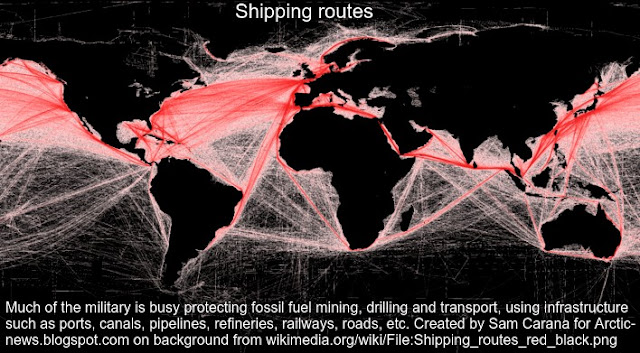
Currently, much fossil fuel is transported by ship. International shipping emissions are not included in national totals of greenhouse gas emissions, despite the huge part of international shipping in global trade, carrying 70% of that trade by value and more than 80% by volume. Near the coast, batteries are increasingly powering shipping, but in international waters, shipping is almost entirely powered by fossil fuel, mainly bunker oil. Some 43% of maritime transport is busy merely moving fuel across the globe, so terminating fuel usage on land could in itself almost halve international shipping emissions.
In addition to commercial emissions caused by shipping of fuel, there are also military emissions that are excluded in national totals, such as international use by the military of bunker fuels and jet fuel, greenhouse gas emissions from energy consumption of bases abroad and the manufacture of equipment used by the military abroad. A large part of the military is busy securing and protecting global supply lines for fossil fuel, while burning huge amounts of fuel in the process. A 2019 analysis found that the US military's global supply chain and heavy reliance on carbon-based fuels make it the largest institutional consumer of oil and one of the largest greenhouse gas emitters, more than many countries worldwide.
Disputes over possession of fossil fuel are behind many international conflicts. Instead, nations can each cater for their power needs more independently and securely by transitioning to clean, renewable energy. A large part of a nation's infrastructure is used to transport fuel domestically, including trucks driving on roads and highways, while also using tunnels and bridges, parking places and stations for refuelling, while additionally fuel is transported by trains, planes and vessels that need ports, railways stations and tracks, and a lot of fossil fuel is burned in the process of transporting the fuel and constructing and maintaining these facilities.
Furthermore, part of the wood from forests and crops from farmland is used to supply biofuel, for use either to power vehicles, for heating or as fuel for power plants. Reducing the use of fuel will therefore also reduce nations getting into conflict with other nations, not only conflict over the possession of fossil fuel and over water to cool power plants, but also conflict over land and water that is used for agriculture and forestry to grow biofuel.
Pyrolysis of biowaste is recommended as this can turn most carbon into biochar, resulting in high carbon sequestration rates, and increased capacity of the soil to retain carbon, nutrients and moisture, thus reducing erosion, fire hazards and greenhouse gas emissions, while increasing vegetation growth resulting in additional drawdown of carbon from the atmosphere.
Most of the biowaste can be pyrolyzed and returned to the soil in the form of biochar. Some of the biowaste can also be used to construct buildings. Instead of cutting down the largest and most healthy trees to do so, which now all too often happens, it makes more sense to instead remove only dead trees and biowaste from the forest floor. Such use of biowaste could provide funding for the process of waste removal from the forest floor. For most biowaste (including kitchen and garden waste, and sewage), it makes sense to turn it into biochar that is added to the soil.
"The carbon content of biochar varies with feedstock and production conditions from as low as 7% (gasification of biosolids) to 79% (pyrolysis of wood at above 600 °C). Of this initial carbon, 63-82% will remain unmineralized in soil after 100 years at the global mean annual cropland-temperature of 14.9 °C", a 2021 study concludes.
"The carbon content of biochar varies with feedstock and production conditions from as low as 7% (gasification of biosolids) to 79% (pyrolysis of wood at above 600 °C). Of this initial carbon, 63-82% will remain unmineralized in soil after 100 years at the global mean annual cropland-temperature of 14.9 °C", a 2021 study concludes.
 |
| [ from earlier post ] |
The above image shows how policies described in the Climate Plan can reduce the cost of energy and the cost of food, and facilitate the necessary transformation of society. The image shows examples of feebates that can help transform society in sectors such as agriculture, forestry, oceans, waste management and construction (center panel). The image also shows examples of local feebates to facilitate the transition to clean, renewable energy (top panel), as further discussed below.
 |
| [ from earlier post, click on image to enlarge ] |
As said, the cost of energy can best be reduced by a rapid transition to clean, renewable energy.
Much land is currently used for mining and drilling, refining and transport of fossil fuel (including roads, railways, ports and military protection to secure supply lines).
Much land is also used to grow crops and trees that are burned for energy, such as wood used for heating, wood fed into power plants and crops grown for biofuel to power vehicles.
Mining, drilling and power plants are also large users of water. They need a lot of water, mainly for cooling, and they can pollute the water they use.
Instead, by using electricity that is generated by wind turbines and solar panels, the total amount of water and the total area of land that is needed to produce energy can be reduced dramatically.

Furthermore, part of the wood from forests and crops from farmland is used to supply biofuel, for use either to power vehicles, for heating or as fuel for power plants. Reducing the use of fuel will therefore also reduce nations getting into conflict with other nations, not only conflict over the possession of fossil fuel and over water to cool power plants, but also conflict over land and water that is used for agriculture and forestry to grow biofuel.
The easiest way to reduce the cost of conflict is to take away the reason for conflict, which in this case is the use of land to produce fuel.
In the video below, Robert Llewellyn interviews Mark Jacobson about The Climate Crisis.
Clean, renewable energy in the form of electricity generated by solar panels and wind turbines is already more economic than burning fuel for energy. Shifting to clean energy will thus lower the cost of energy, while people will also be less burdened by the cost of associated conflicts, which is more than the cost of the military and police taking care to avoid conflict, as the cost is even larger than that if conflicts do escalate and cause destruction of infrastructure, damage to soil and ecosystems and loss of lives, health and livelihood for all involved.
The comprehensive and effective action proposed by the Climate Plan can terminate the use of fuel and thus also reduce conflict, while additionally reducing the threat of runaway warming, and while additionally providing many environmental benefits and further benefits such as the termination of perceived needs for military forces to police global fuel supply lines and associated infrastructure.
Links
• Climate Plan (page)
https://arctic-news.blogspot.com/p/climateplan.html
• Climate Plan (post)
https://arctic-news.blogspot.com/2019/06/climate-plan.html
• Climate Plan (group)
https://www.facebook.com/groups/ClimatePlan
• Air Taxis (group)
https://www.facebook.com/groups/AirTaxis
• Biochar (group)
https://www.facebook.com/groups/biochar
• Vegan Organic Food (group)
https://www.facebook.com/groups/VeganOrganicFood
• Secretary-General Warns of Unprecedented Global Hunger Crisis, with 276 Million Facing Food Insecurity, Calling for Export Recovery, Debt Relief (June 24, 2022)
https://press.un.org/en/2022/sgsm21350.doc.htm
• Confirm Methane's Importance
https://arctic-news.blogspot.com/2021/03/confirm-methanes-importance.html
• Land Use - by Hannah Ritchie and Max Roser
• Greenhouse Gas Inventory Model for Biochar Additions to Soil - by Dominic Woolf et al.
In conclusion, reducing the use of fuel will in itself further reduce demand for fuel and the cost of energy. Replacing fuel by clean, renewable energy can additionally cut the need for energy through greater efficiencies of electric motors, appliances and devices. As said, this will also reduce the need for land and water, and - this cannot be said enough - avoid or delay climate collapse and catastrophe.
Air Taxis and Urban Redesign can further facilitate the necessary transformation

Electric vertical take-off and landing (eVTOL) air taxis can be an important component of the transformation of the way we travel, live, work and eat.
Using eVTOL air taxis can reduce the need for roads and associated infrastructure, further freeing up land, while the transition to electricity generated with solar panels and wind turbines can additionally free up land that is now used by utilities and their associated infrastructure such as power plants, power poles and towers, communication poles, etc. This land can instead be used for community gardens, (food) forests, parks, etc.
This doesn't have to be an instant shift. In existing cities, there already is a strong and growing movement to restrict the use of cars in city centers, and to instead add more walkways and bikeways. In this case, the roads will still be there, it's just their usage that changes. Another example is pipes. Many cities want to disconnect pipes that now supply natural gas to buildings, as it makes more sense to use electricity instead. The pipes will still be there, they just won't be used anymore, if at all. Digging up the pipes may make sense, but this may take some effort and time and it's therefore important that this issue is not used as an excuse to delay the rapid transition to the use of clean energy that is so urgently needed.
It's important to look at longer-term and more radical redesign. The transition toward greater use of air taxis enables space previously used for roads to instead be used for more walkways and bikeways, as well as for trees, community gardens, etc. This should be incorporated as part of wider and longer-term planning and redesign of urban areas.
In some places, this can lead to a more compact urban design, especially in city centers. After all, a lot of space becomes available as the use of roads for vehicle movements and for parking is reduced in an urban area, and this allows for more compact construction of new buildings and renovation of existing buildings that also reduces the distance between buildings, thus shortening the time it takes for trips by foot or bike in the city center, while there also will be plenty of opportunities for spaces to be created for air taxis to land and take off, e.g. in parks and on top of buildings.
At the same time, air taxis enable trips of up to a few hundred miles to be completed fast, while using little energy and causing little emissions. Furthermore, more remote places can be economically reached by air taxis without a need for roads to lead them to these places or for railway stations to be located nearby. Drone delivery of goods and air taxis can enable more people to live outside urban areas. More people will be able to have goods delivered to their home and to reach urban amenities if and when they want to, and more economically compared to using cars and roads.
The need for land and water to produce food and energy, and the need for land to transport goods and food can be reduced with the transitions to clean energy and to vegan-organic food. These transitions can also reduce the need for infrastructure such as pipes and poles for water supply, sewage, communications and power. Instead, we can have solar panels, microgrids, WiFi, rainwater tanks, biochar units, food forests and community gardens.
The image below illustrates how policies recommended in the Climate Plan can further reduce the need for infrastructure by supporting eVTOL air taxis, while transforming the space thus gained into community gardens, walkways, bikeways, etc.
In conclusion, the situation can best be addressed through action as described in the Climate Plan, where needed in combination with a Climate Emergency Declaration.
Air Taxis and Urban Redesign can further facilitate the necessary transformation

Electric vertical take-off and landing (eVTOL) air taxis can be an important component of the transformation of the way we travel, live, work and eat.
Using eVTOL air taxis can reduce the need for roads and associated infrastructure, further freeing up land, while the transition to electricity generated with solar panels and wind turbines can additionally free up land that is now used by utilities and their associated infrastructure such as power plants, power poles and towers, communication poles, etc. This land can instead be used for community gardens, (food) forests, parks, etc.
This doesn't have to be an instant shift. In existing cities, there already is a strong and growing movement to restrict the use of cars in city centers, and to instead add more walkways and bikeways. In this case, the roads will still be there, it's just their usage that changes. Another example is pipes. Many cities want to disconnect pipes that now supply natural gas to buildings, as it makes more sense to use electricity instead. The pipes will still be there, they just won't be used anymore, if at all. Digging up the pipes may make sense, but this may take some effort and time and it's therefore important that this issue is not used as an excuse to delay the rapid transition to the use of clean energy that is so urgently needed.
It's important to look at longer-term and more radical redesign. The transition toward greater use of air taxis enables space previously used for roads to instead be used for more walkways and bikeways, as well as for trees, community gardens, etc. This should be incorporated as part of wider and longer-term planning and redesign of urban areas.
In some places, this can lead to a more compact urban design, especially in city centers. After all, a lot of space becomes available as the use of roads for vehicle movements and for parking is reduced in an urban area, and this allows for more compact construction of new buildings and renovation of existing buildings that also reduces the distance between buildings, thus shortening the time it takes for trips by foot or bike in the city center, while there also will be plenty of opportunities for spaces to be created for air taxis to land and take off, e.g. in parks and on top of buildings.
At the same time, air taxis enable trips of up to a few hundred miles to be completed fast, while using little energy and causing little emissions. Furthermore, more remote places can be economically reached by air taxis without a need for roads to lead them to these places or for railway stations to be located nearby. Drone delivery of goods and air taxis can enable more people to live outside urban areas. More people will be able to have goods delivered to their home and to reach urban amenities if and when they want to, and more economically compared to using cars and roads.
The need for land and water to produce food and energy, and the need for land to transport goods and food can be reduced with the transitions to clean energy and to vegan-organic food. These transitions can also reduce the need for infrastructure such as pipes and poles for water supply, sewage, communications and power. Instead, we can have solar panels, microgrids, WiFi, rainwater tanks, biochar units, food forests and community gardens.
The image below illustrates how policies recommended in the Climate Plan can further reduce the need for infrastructure by supporting eVTOL air taxis, while transforming the space thus gained into community gardens, walkways, bikeways, etc.
 |
| [ from an earlier post ] |
Links
• Climate Plan (page)
https://arctic-news.blogspot.com/p/climateplan.html
• Climate Plan (post)
https://arctic-news.blogspot.com/2019/06/climate-plan.html
• Climate Plan (group)
https://www.facebook.com/groups/ClimatePlan
• Air Taxis (group)
https://www.facebook.com/groups/AirTaxis
• Biochar (group)
https://www.facebook.com/groups/biochar
• Vegan Organic Food (group)
https://www.facebook.com/groups/VeganOrganicFood
• Secretary-General Warns of Unprecedented Global Hunger Crisis, with 276 Million Facing Food Insecurity, Calling for Export Recovery, Debt Relief (June 24, 2022)
https://press.un.org/en/2022/sgsm21350.doc.htm
• Confirm Methane's Importance
https://arctic-news.blogspot.com/2021/03/confirm-methanes-importance.html
• Land Use - by Hannah Ritchie and Max Roser
• Global agricultural green and blue water consumption under future climate and land use changes - by Zhongwei Huang et al.
https://www.sciencedirect.com/science/article/abs/pii/S002216941930383X
https://www.sciencedirect.com/science/article/abs/pii/S002216941930383X
• UN - population
• 400,000 Pyrolysis Plants to Save the Climate - by Hans-Peter Schmidt and Nikolas Hagemann (2021)
• Greenhouse Gas Inventory Model for Biochar Additions to Soil - by Dominic Woolf et al.
https://pubs.acs.org/doi/full/10.1021/acs.est.1c02425
• Nitrogen fertiliser use could ‘threaten global climate goals’
https://www.carbonbrief.org/nitrogen-fertiliser-use-could-threaten-global-climate-goals
• IPCC AR6 WG1 Chapter 7
https://www.ipcc.ch/report/ar6/wg1/downloads/report/IPCC_AR6_WGI_Chapter_07.pdf
• Synergistic HNO3 H2SO4 NH3 upper tropospheric particle formation - by Mingyi Wang et al. (2022)
https://www.nature.com/articles/s41586-022-04605-4
• IPCC AR6 WG1 Chapter 4
https://www.ipcc.ch/report/ar6/wg1/downloads/report/IPCC_AR6_WGI_Chapter_04.pdf
• Low oxygen eddies in the eastern tropical North Atlantic: Implications for N2O cycling - by D. Grundle et al. (2017)
https://www.nature.com/articles/s41598-017-04745-y
• Increased nitrous oxide emissions from Arctic peatlands after permafrost thaw - by Carolina Voigt et al. (2017)
https://www.pnas.org/doi/10.1073/pnas.1702902114
• Low-cost solutions to global warming, air pollution, and energy insecurity for 145 countries - by Mark Jacobson et al.
• Numerous Benefits of 100% Clean, Renewable Energy
• How Much Water Do Power Plants Use?
https://blog.ucsusa.org/john-rogers/how-much-water-do-power-plants-use-316
• Why does the Carmichael coal mine need to use so much water?
• Emissions from fuels used for international aviation and maritime transport
• News release: No environmental justice, no positive peace — and vice versa
https://www.hiroshima-u.ac.jp/en/news/73129
• Study: A global analysis of interactions between peace and environmental sustainability - by Dahylia Simangan et al.
https://www.sciencedirect.com/science/article/pii/S2589811622000210
https://www.pnas.org/doi/10.1073/pnas.1702902114
• Low-cost solutions to global warming, air pollution, and energy insecurity for 145 countries - by Mark Jacobson et al.
• Numerous Benefits of 100% Clean, Renewable Energy
https://blog.ucsusa.org/john-rogers/how-much-water-do-power-plants-use-316
• View your government’s military emissions data
https://militaryemissions.org
• Military emissions
https://militaryemissions.org/wp-content/uploads/2022/06/military-emissions_final.pdf
https://militaryemissions.org
• Military emissions
https://militaryemissions.org/wp-content/uploads/2022/06/military-emissions_final.pdf
https://unfccc.int/topics/mitigation/workstreams/emissions-from-international-transport-bunker-fuels
• Decarbonizing the maritime sector: Mobilizing coordinated action in the industry using an ecosystems approach
• Assessing possible impacts on States of future shipping decarbonization
• News release: No environmental justice, no positive peace — and vice versa
https://www.hiroshima-u.ac.jp/en/news/73129
• Study: A global analysis of interactions between peace and environmental sustainability - by Dahylia Simangan et al.
https://www.sciencedirect.com/science/article/pii/S2589811622000210
• Also discussed at:
• Costs of War - Neta Crawford