Monday, August 22, 2022

Dangerously large Arctic sea ice extent

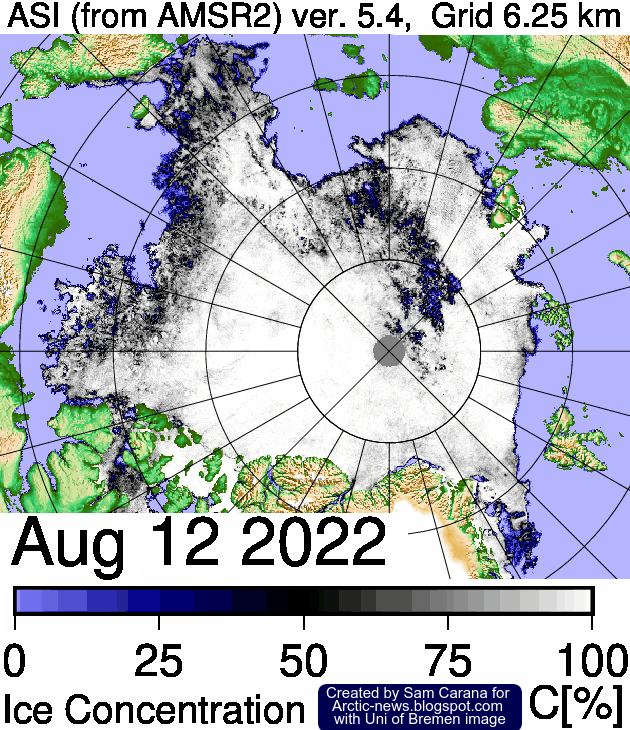
Arctic sea ice extent was 5.88 million km² on August 21, 2022, larger in extent than in any of the years from 2010 through 2021 at this time of year, as illustrated by the NSIDC image below. 


At first glance, one might think that this relatively large extent was a sign of healthy sea ice. After all, the larger the sea ice, the more sunlight gets reflected back into space. At the same time, however, the situation is very dangerous, as there is a growing risk that large eruptions of methane will occur from the seafloor of the Arctic Ocean.

Why is the situation so dangerous? There are many contributors to the danger, three of them are:

1. Ice acts as a seal

Ice acts as a seal, insulating the soil from warmer air and holding the soil together, like a glue. A 2022 study by Elizabeth Webb et al. concludes that rainwater carries heat into the soil and accelerates permafrost thaw, and the glue that holds the soil together disappears. This can open up underground channels that drain the surface. 

Rainwater can also travel along cracks deeper into sediments, where the heat can destabilize methane hydrates, resulting in the release of large amounts of methane into the atmosphere from hydrates and from gas underneath hydrates. As temperatures rise in the Arctic, more rain will fall over the Arctic, increasing this danger.


Where rain falls onto the sea ice, the rainwater also adds heat to the sea ice, speeding up its demise, and stronger winds can further accelerate this. The compound impact is that such feedbacks accelerate the pace at which the Arctic is warming, but as long as air temperatures are low enough, there will continue to be sea ice that acts as a seal, impeding transfer of ocean heat from the Arctic Ocean to the atmosphere. 

Temperatures in the Arctic are rising faster than in the rest of the world. As temperatures rise in the Arctic, increased precipitation, meltwater and runoff from land, and flow of freshwater from rivers all decrease salinity of the water in the Arctic Ocean. Lower salinity makes it harder for sea ice to melt. 

As temperatures in the Arctic are rising faster than in the rest of the world, the Jet stream is getting deformed. Deformation of the Jet Stream causes more wind to go over the Arctic Ocean, which can cool down the sea surface, resulting in more extensive sea ice. 

Furthermore, we're currently in the depth of a persistent La Niña (NOAA image on the right), and the associated lower air temperatures further contribute to a relatively larger extent of the sea ice. 

More extensive sea ice in turn makes it harder for ocean heat to be transferred to the atmosphere, thus instead raising the temperature of the water of the Arctic Ocean.


The larger the sea ice is in extent, the less ocean heat can be transferred from the Arctic Ocean to the atmosphere, which means that more heat will remain in the Arctic Ocean.

2. Lid on North Atlantic

Ocean stratification is increasing globally, as ocean warming is stronger for upper layers versus the deep ocean. Stratification increased from 1960 to 2018 by 5.3% for the upper 2000m and by as much as 18% for the upper 150m, while salinity changes also play an important role locally, a 2020 study finds.

[ SSTA (left) and SST (right), August 23, 2022 - click on image to enlarge ]

Deformation of the Jet Stream can at times strongly increase evaporation over the North Atlantic with more precipitation further down the path of the Atlantic meridional overturning circulation (AMOC).

Deformation of the Jet Stream can also increase runoff from land (including from melting glaciers).

In both these cases, this can contribute to the formation and growth of a relatively cold, freshwater lid at the surface of the North Atlantic.


This lid on the North Atlantic reduces transfer of ocean heat to the atmosphere and enables large amounts of salty, warm water to enter the Arctic Ocean, diving under the sea ice. 

This lid also increases the risk of a sudden, large influx of hot, salty water. Slowdown of AMOC causes ocean heat to accumulate, while more warm water travels underneath this lid (instead of at the sea surface) toward the Arctic Ocean. As the Jet Stream gets more deformed, strong winds along the path of AMOC can at times speed up the flow of water that travels underneath this cold freshwater lid over the North Atlantic, suddenly pushing large amounts of salty, warm water into the Arctic Ocean. 

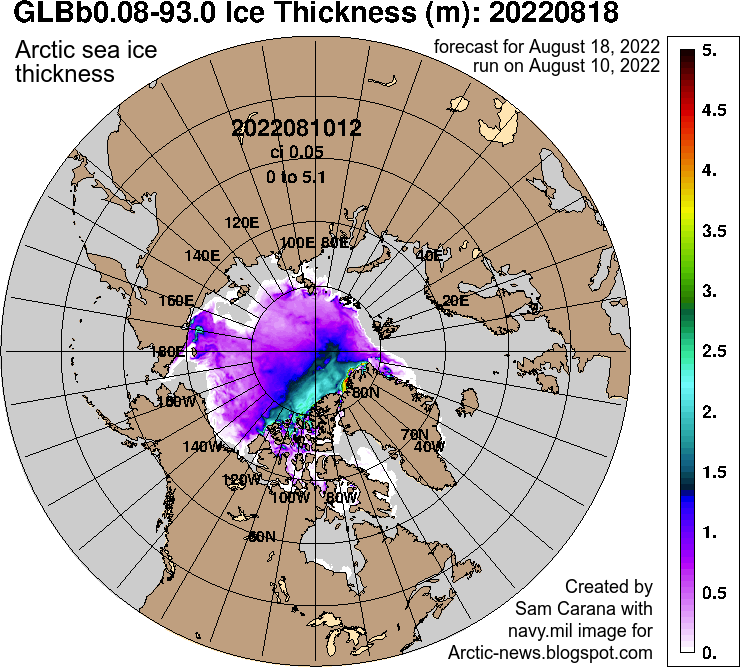
3. Latent heat buffer loss

The navy.mil combination image below has three panels. The left panel shows the sea ice on August 30, 2012, the center panel shows the sea ice on August 30, 2015, and the right panel shows a forecast for the sea ice for August 30, 2022, run on August 22, 2022.


The image illustrates that Arctic sea ice is currently larger in extent than it was in 2012 and 2015 at this time of year, while there has been a dramatic reduction in thickness of the sea ice over time.

Sea ice acts as a buffer that absorbs heat, while keeping the temperature at zero degrees Celsius. As long as there is sea ice in the water, this sea ice will keep absorbing heat, so the temperature doesn't rise at the sea surface. The amount of energy absorbed by melting ice is as much as it takes to heat an equivalent mass of water from zero to 80°C.


This ice has meanwhile all but disappeared, so without this latent heat buffer further incoming heat must go elsewhere, i.e. the heat will further raise the temperature of the water of the Arctic Ocean.

Compound impact

The danger is that, as more salty, warm water keeps arriving in the Arctic Ocean while the latent heat buffer has largely disappeared and while sea ice extent is relatively large, this will raise the temperatures and salinity levels at the bottom of the Arctic Ocean enough to destabilize hydrates in sediment at the seafloor of the Arctic Ocean, resulting in methane eruptions both from these hydrates and from free gas underneath these hydrates.

[ The Buffer has gone, feedback #14 on the Feedbacks page ]
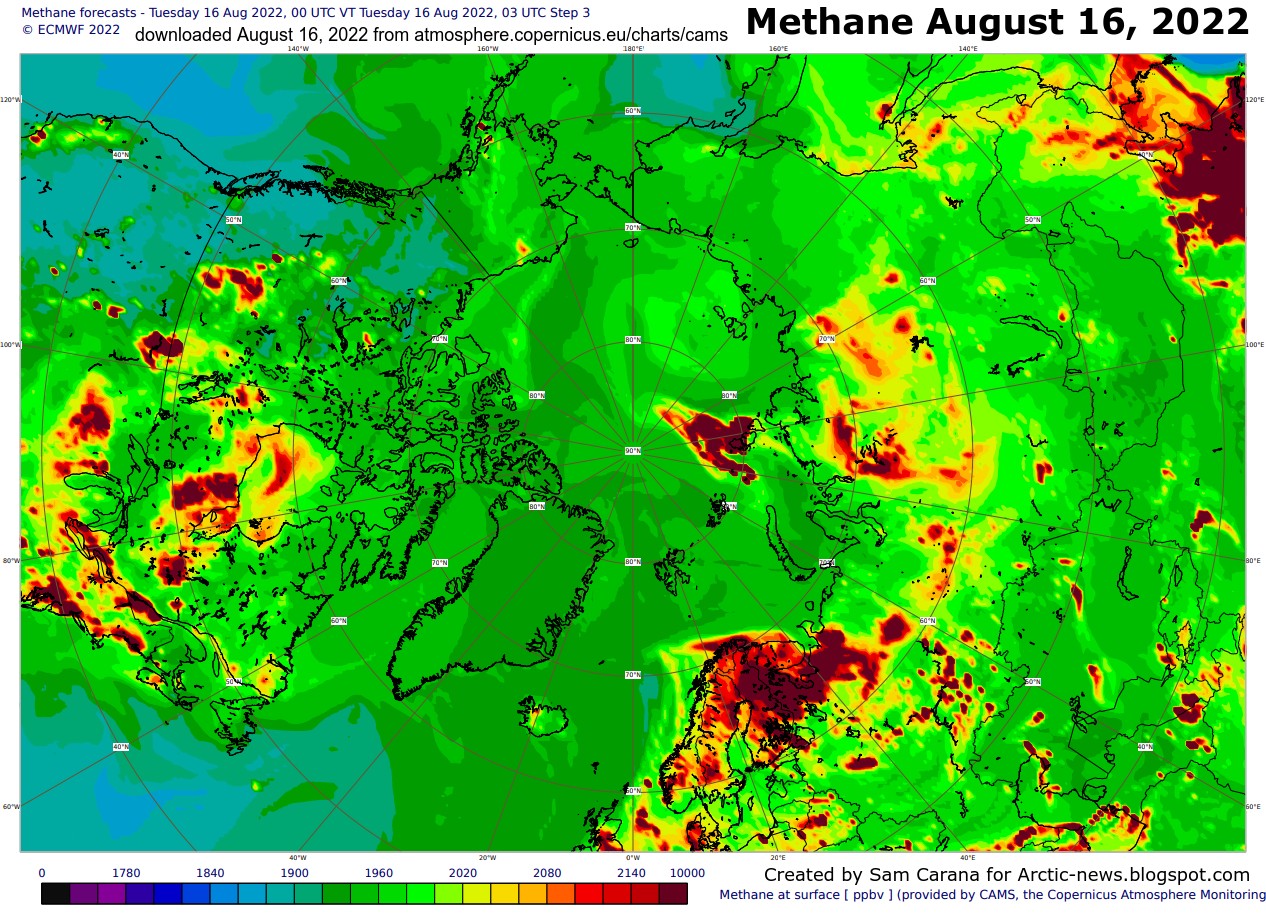
Very high methane levels

The Copernicus image below shows a forecast of high levels of methane over the Arctic on August 28, 2022 18:00 UTC at 500 hPa. 


Methane levels are already at record high and growth is accelerating, even without an extra burst of seafloor methane. The NOAA record shows that methane grew by 18.31 ppb in 2021, the highest annual growth on record. 

The most recent monthly NOAA data are for the globally averaged marine surface mean for April 2022, which was 1909.9 ppb. This is 18.7 ppb higher than April 2021, as illustrated by the image on the right, from an earlier post.

NOAA's data are for marine surface measurements. More methane tends to accumulate at higher altitudes, as illustrated by the two data images on the right.

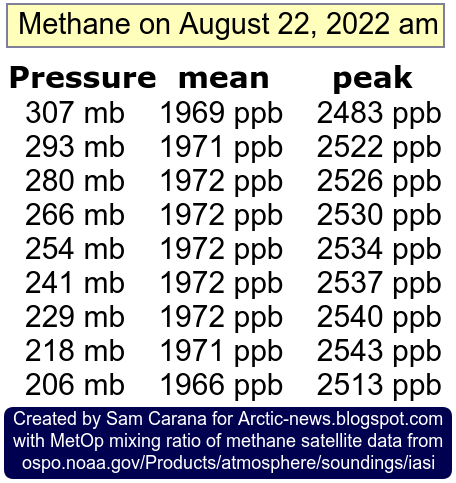
The top data image on the right shows methane recorded by the MetOp satellite on August 22, 2022 am. The image shows means of 1972 ppb at five pressure levels (of 280 mb and less), with a peak level of 2543 ppb, the highest that day, occurring at 218 mb.

The second data image on the right shows methane means recorded by the MetOp satellite on August 25, 2022 pm of 1975 ppb at four pressure levels (at 254 mb, 266 mb, 280 mb and 283 mb).

The image underneath on the right shows a methane peak of 2622 ppb (marked by the red oval), recorded by the N20 satellite on August 20, 2022 am at 399.1 mb. High methane levels are visible north of Siberia, indicating that much of the methane may originate in the Arctic.

Another N20 satellite image is added underneath showing high methane concentrations over the Arctic, also on August 20, 2022 am, but at 695.1 mb, which is much closer to sea level. This confirms that much of the methane may have originated in the Arctic.

An image is added underneath from another satellite, the MetOp satellite, also showing high methane concentrations over the Arctic, also on August 20, 2022 am, this time at 586 mb, further confirming that much of the methane may have originated in the Arctic.

A large abrupt methane release could double the methane in the atmosphere. Methane releases from the seafloor of the Arctic Ocean are very dangerous because there is very little hydroxyl in the atmosphere over the Arctic to break down the methane.
A level twice as high as that 1975 ppb mean is a mean of 3950 ppb, and when using a 1-year GWP of 200, this translates into 790 ppm CO₂e, i.e. only 410 ppm away from the 1200 ppm clouds tipping point.

The average monthly CO₂ at Mauna Loa, Hawaii, was 420.99 ppm both in May and in June 2022. As illustrated by the image on the right, average daily CO₂ hasn't been below 416 ppm in July and August 2022, while some hourly measurements were around 425 ppm CO₂.
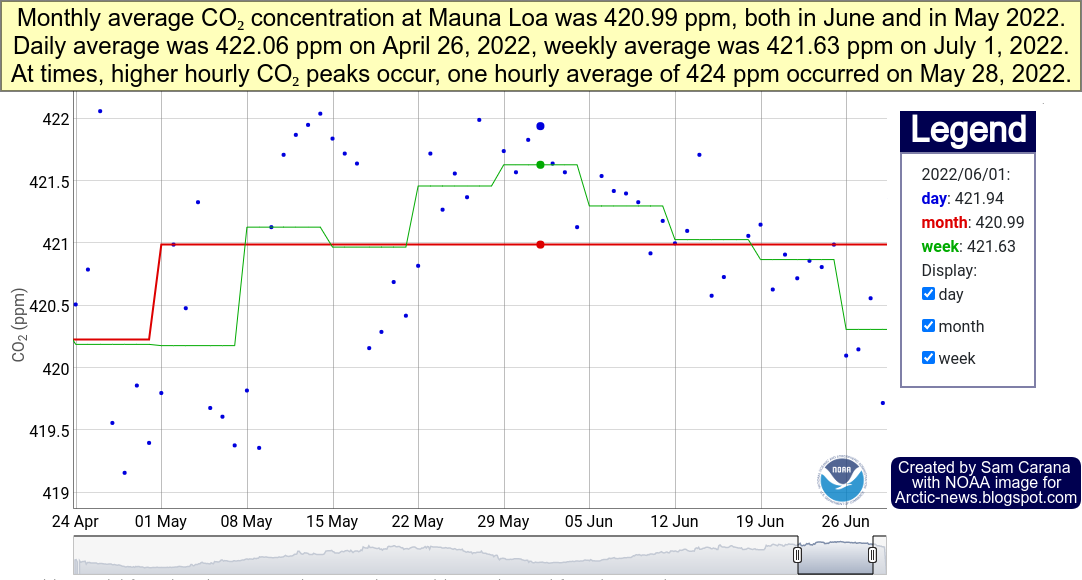
On August 25, 2022 16:30 UTC, CO₂ at the North Pole was 422 ppm, as illustrated by the nullschool.net image on the right. 

In other words, a large eruption of methane from the seafloor of the Arctic Ocean could abruptly cause the joint CO₂e of just two greenhouse gases, i.e. methane and CO₂, to cross the 1200 ppm clouds tipping point globally and trigger a further 8°C global temperature rise, due to the clouds feedback alone. When adding further forcers, a huge temperature rise could be triggered even with far less methane erupting from the seafloor.

Conclusion

In conclusion, there is a growing danger that methane will erupt from the seafloor of the Arctic Ocean and cause a dramatic rise in temperature.

Even without such eruption of methane from the seafloor of the Arctic Ocean, temperatures look set to rise strongly soon, as we move into an El Niño and face a peak in sunspots. 

Either way, the resulting temperature rise could drive humans extinct as early as in 2025 with temperatures continuing to skyrocket in 2026

This makes it in many respects rather futile to speculate about what will happen beyond 2026. At the same time, the right thing to do now is to help avoid the worst things from happening, through comprehensive and effective action as described in the Climate Plan.


Arctic sea ice (earlier posts in 2022)

• Arctic sea ice June 2022 - why the situation is so dangerous
https://arctic-news.blogspot.com/2022/06/arctic-sea-ice-june-2022-why-situation-is-so-dangerous.html

• Arctic sea ice July 2022
https://arctic-news.blogspot.com/2022/07/arctic-sea-ice-july-2022.html

• Arctic sea ice August 2022


Further links

• Permafrost thaw drives surface water decline across lake-rich regions of the Arctic - by Elizabeth Webb et al. 
also discussed at: 

• Increasing ocean stratification over the past half-century - by Guancheng Li et al. 
https://www.nature.com/articles/s41558-020-00918-2

• The ocean has become more stratified with global warming - news release

• IPCC AR6 WG1 SPM


• NOAA - Globally averaged marine surface annual mean methane growth rates.

• NOAA - Trends in Atmospheric Carbon Dioxide

• NOAA - MetOp satellite 

• NOAA - N20 satellite

• Jet Stream
https://arctic-news.blogspot.com/p/jet-stream.html

• Cold freshwater lid on North Atlantic
https://arctic-news.blogspot.com/p/cold-freshwater-lid-on-north-atlantic.html

• NOAA - Monthly Temperature Anomalies Versus El Niño
https://www.ncei.noaa.gov/access/monitoring/monthly-report/global/202207/supplemental/page-4

• University of Bremen
https://seaice.uni-bremen.de/databrowser

• NSIDC - Arctic sea ice concentration
https://nsidc.org/arcticseaicenews

• NSIDC - Chartic, interactive sea ice graph
https://nsidc.org/arcticseaicenews/charctic-interactive-sea-ice-graph

• NOAA - Trends in Atmospheric Methane
https://gml.noaa.gov/ccgg/trends_ch4

• nullschool
https://earth.nullschool.net

• Naval Research Laboratory
https://www7320.nrlssc.navy.mil/GLBhycomcice1-12/arctic.html

• Understanding the Permafrost–Hydrate System and Associated Methane Releases in the East Siberian Arctic Shelf - by Natalia Shakhova et al. (2019)
https://www.mdpi.com/2076-3263/9/6/251


• Warning of mass extinction of species, including humans, within one decade
https://arctic-news.blogspot.com/2017/02/warning-of-mass-extinction-of-species-including-humans-within-one-decade.html

• Cold freshwater lid on North Atlantic
https://arctic-news.blogspot.com/p/cold-freshwater-lid-on-north-atlantic.html

• Albedo, latent heat, insolation and more
https://arctic-news.blogspot.com/p/albedo.html

• Latent Heat Buffer
https://arctic-news.blogspot.com/p/latent-heat.html

• Feedbacks in the Arctic
https://arctic-news.blogspot.com/p/feedbacks.html

• Clouds feedback
https://arctic-news.blogspot.com/p/clouds-feedback.html

• How much time is there left to act?
https://arctic-news.blogspot.com/p/how-much-time-is-there-left-to-act.html

• Sunspots
https://arctic-news.blogspot.com/p/sunspots.html

• Cataclysmic Alignment
https://arctic-news.blogspot.com/2022/06/cataclysmic-alignment.html

• Human Extinction by 2025?
https://arctic-news.blogspot.com/2022/07/human-extinction-by-2025.html

• Extinction
https://arctic-news.blogspot.com/p/extinction.html

• Climate Plan
https://arctic-news.blogspot.com/p/climateplan.html


Wednesday, August 10, 2022

Arctic sea ice August 2022

Ocean currents keep pushing heat toward the Arctic Ocean

Arctic sea ice is getting very thin, as temperatures keep rising and ocean currents keep pushing heat toward the Arctic, as illustrated by the NOAA image below that shows sea surface temperatures as high as 33°C or 91.4°F on August 13, 2022. 


The Gulf Stream is an ocean current that extends into the Arctic Ocean, as pictured below and discussed at this page. This ocean current is driven by the Coriolis force and by prevailing wind patterns. 

[ from earlier post ]
This ocean current contributes to the stronger and accelerating warming of the Arctic (compared to the rest of the world), which in turn causes deformation of the Jet Stream that can at times cause strong winds to speed up this ocean current. The image below shows the Jet Stream over the North Atlantic, where the ocean current dives under the sea ice. Sea surface temperature anomalies are much lower over the area where the deformed Jet Stream causes water to evaporate, thus cooling the surface. 


The danger is that a cold freshwater lid grows at the surface of the North Atlantic that enables large amounts of salty, warm water to dive under the sea ice and enter the Arctic Ocean, as discussed earlier here, as well as here and at the feedbacks page


Latent heat

Latent heat is ocean heat that is, or rather was previously consumed by melting of the sea ice underneath the sea surface. 

[ The Latent Heat Buffer ]
This ice has meanwhile all but disappeared, so without this latent heat buffer further incoming heat must go elsewhere, i.e. the heat will further raise the temperature of the water and it will also cause more evaporation to take place where the sea ice has disappeared altogether, and this in turn will further heat up the atmosphere over the Arctic. 

The nullschool.net image below shows sea surface temperature anomalies from 1981-2011. At the green circle, anomalies were 16.1°C or 29°F on August 9, 2022. Back in 1981-2011, the temperature at that spot was 0°C. 


Thin layer of sea ice

The image below, adapted from University of Bremen, shows Arctic sea ice concentration on August 12, 2022, with concentration in a large area close to the North Pole as low as 0%.


The image below, from NSIDC, also shows sea ice concentration on August 9, 2022. 


The Naval Research Laboratory image below, a forecast for August 18, 2022, run on August 10, 2022, shows that the sea ice is getting very thin. 

Danger of methane eruptions

The navy.mil combination image below has three panels. The left panel shows the sea ice on August 30, 2012, the center panel shows the sea ice on August 30, 2015, and the right panel shows a forecast for the sea ice for August 21, 2022. 

[ click on images to enlarge ]
[ click on images to enlarge ]
There still is a relatively extensive but very thin layer of sea ice present at the surface. This is also illustrated by the NSIDC image on the right that shows an Arctic sea ice extent of 6.438 million km² on August 11, 2022. This relatively large extent is mainly due to the suppression of air temperatures that comes with the current La Niña (see images further below). 

As long as air temperatures are low enough to keep this surface ice frozen and as long as there are no strong winds pushing the ice out of the Arctic Ocean, this thin layer of ice will act as a seal, preventing transfer of heat from the Arctic Ocean to the atmosphere. 


The larger the remaining sea ice is in extent, the less ocean heat can be transferred from the Arctic Ocean to the atmosphere, which means that more heat will remain in the Arctic Ocean.

[ The Buffer has gone, feedback #14 on the Feedbacks page ]
The danger is that ocean heat keeps arriving in the Arctic Ocean, while the latent heat buffer is gone, causing more of this heat to reach sediments at the seafloor of the Arctic Ocean that threatens to destabilize hydrates in these sediment, resulting in methane eruptions both from these hydrates and from free gas underneath these hydrates.

Record high methane levels 

Methane levels are already at record high and growth is accelerating, even without an extra burst of seafloor methane.

NOAA registered a globally averaged marine surface April 2022 mean of 1909.9 ppb, which is 18.7 ppb higher than April 2021, as illustrated by the image on the right. By comparison, the highest annual growth on the NOAA record is 18.31 ppb for 2021. 

NOAA's data are for marine surface measurements.  More methane tends to accumulate at higher altitudes, as illustrated by the image on the right.

The MetOp satellite recorded a mean global methane level of 1971 ppb at 293 mb on August 11, 2022 am. When using a 1-year GWP of 200, this translates into 394.2 ppm CO₂e.

As the image underneath also shows, the MetOp satellite also recorded a peak methane level of 3009 ppb at 469 mb on August 9, 2022 pm. 

Record high carbon dioxide levels

Carbon dioxide (CO₂) levels have been quite high over the past few months. Monthly CO₂ was 420.99 ppm both in May and in June 2022. Some hourly CO₂ measurements were well above 422 ppm in May 2022. On May 28, 2022, one hourly average at Mauna Loa was recorded of 424 ppm.

When adding this monthly CO₂ concentration of 420.99 ppm to the above 394.2 ppm CO₂e for methane, that gives a total of 815.19 ppm CO₂e. 


Clouds feedback

Copernicus recorded high concentrations of methane over the Arctic Ocean on August 16, 2022 (forecast for 03 UTC run on 00 UTC). 

The image below shows methane at surface level, where the scale goes up to 10,000 ppb. At a 1-year global warming potential of 200, this top end of the scale translates into 2000 ppm CO₂e. 

[ click on images to enlarge ]
This 2000 ppm CO₂e is well above the 1200 ppm CO₂e clouds tipping point that will trigger the disappearance of the lower clouds. The presence of lower clouds and sea ice causes a lot of sunlight to be reflected back into space, so the danger is that at locations where these clouds and sea ice cover have both disappeared, the water of the Arctic Ocean will strongly heat up at this time of year.

What makes the situation in the Arctic very dangerous is that there is very little hydroxyl in the air over the Arctic to break down methane.

Furthermore, the Arctic Ocean in many places is very shallow, especially off the coast of Siberia, as illustrated by the NOAA image on the right. Shallow waters enable hot surface water to be mixed down all the way to the seafloor. 

[ click on images to enlarge ]
This threatens to trigger destabilization of methane hydrates contained in sediments at the seafloor and result in eruption of huge amounts of methane from such hydrates as well as from free gas contained in sediments underneath the hydrates, as illustrated by the image on the right, from this page.

Abrupt eruption of an additional 5 Gt of methane from the seafloor of the Arctic Ocean would double the methane in the atmosphere.  

An amount of 5 Gt of methane is only 10% of the 50 Gt that Natalia Shakhova et al. warned about long ago, while 50 Gt is in turn only a small fraction of all the methane contained in sediments in the Arctic, as illustrated by the image on the right, from Shakhova et al. (2019). 

On its own, a 5 Gt eruption of seafloor methane could raise the global mean methane concentration by as much as 1971 ppb which, at a 1-year GWP of 200, would translate into another 394.2 ppm CO₂e and when added to the above 815.19 ppm CO₂e, adds up to a total of 1209.39 ppm CO₂e.

[ from earlier post, click on images to enlarge ]
So, that would abruptly cause the joint CO₂e of just two greenhouse gases, i.e. methane and CO₂, to cross the 1200 ppm clouds tipping point globally and trigger a further 8°C global temperature rise, due to the clouds feedback alone.

There are further forcers and feedbacks to be taken into account, which means that the clouds tipping point could be crossed globally even with a far smaller abrupt release of seafloor methane. While it would take longer for the clouds tipping points to get crossed that way, the associated temperature rise could be enough to drive humans into extinctions well before the tipping point was even reached. A rise of 3°C above pre-industrial could occur on land and drive humans into extinction by 2025.

La Niña

[ adapted from NOAA - click on images to enlarge ]
As said, sea ice extent is relatively large at the moment, because we are currently in the depths of a persistent La Niña, which is suppressing the temperature rise.

El Niños typically occur every 3 to 5 years, according to NOAA and as also illustrated by the NOAA image below, so the upcoming El Niño can be expected to occur soon.

The NOAA image below indicates that going from the bottom of a La Niña to the peak of an El Niño could make a difference of more than half a degree Celsius (0.5°C or 0.9°F).


Furthermore, the rise in sunspots from May 2020 to July 2025 could make a difference of some 0.15°C (0.27°F). The next El Niño looks set to line up with a high peak in sunspots, in a cataclysmic alignment that could push up the temperature enough to cause even more dramatic sea ice loss in the Arctic, resulting in runaway temperature rise.

Conclusion

In conclusion, there is a growing risk that methane will erupt from the seafloor of the Arctic Ocean and cause a dramatic rise in temperature. 

Even without such eruption of methane from the seafloor of the Arctic Ocean, temperatures look set to rise strongly soon, as we move into an El Niño and face a peak in sunspots. The resulting temperature rise could drive humans extinct as early as in 2025 with temperatures continuing to skyrocket in 2026, making it in many respects rather futile to speculate about what will happen beyond 2026. 

At the same time, the right thing to do now is to help avoid the worst things from happening, through comprehensive and effective action as described in the Climate Plan.


Arctic sea ice (previous months)

• Arctic sea ice June 2022 - why the situation is so dangerous

• Arctic sea ice July 2022


Further links

• NOAA - Sea Surface Temperature (SST) Contour Charts
• Jet Stream
https://arctic-news.blogspot.com/p/jet-stream.html

• Cold freshwater lid on North Atlantic
https://arctic-news.blogspot.com/p/cold-freshwater-lid-on-north-atlantic.html

• NOAA - ENSO: Recent Evolution, Current Status and Predictions
https://www.cpc.ncep.noaa.gov/products/analysis_monitoring/lanina/enso_evolution-status-fcsts-web.pdf

• NOAA - Monthly Temperature Anomalies Versus El Niño
https://www.ncei.noaa.gov/access/monitoring/monthly-report/global/202207/supplemental/page-4

• University of Bremen
https://seaice.uni-bremen.de/databrowser

• NSIDC - Arctic sea ice concentration

• NSIDC - Chartic, interactive sea ice graph

• NOAA - Trends in Atmospheric Methane

• nullschool
https://earth.nullschool.net

• Naval Research Laboratory
https://www7320.nrlssc.navy.mil/GLBhycomcice1-12/arctic.html

• Understanding the Permafrost–Hydrate System and Associated Methane Releases in the East Siberian Arctic Shelf - by Natalia Shakhova et al. (2019) 
https://www.mdpi.com/2076-3263/9/6/251

• Warning of mass extinction of species, including humans, within one decade
• Cold freshwater lid on North Atlantic

• Albedo, latent heat, insolation and more
https://arctic-news.blogspot.com/p/albedo.html

• Latent Heat Buffer
https://arctic-news.blogspot.com/p/latent-heat.html

• Feedbacks in the Arctic
https://arctic-news.blogspot.com/p/feedbacks.html

• Clouds feedback
https://arctic-news.blogspot.com/p/clouds-feedback.html

• How much time is there left to act?


Saturday, July 23, 2022

Arctic sea ice July 2022

Blue Ocean Event

[ from Blue Ocean Event ]
A Blue Ocean Event occurs when virtually all sea ice disappears and the surface color changes from white (sea ice) to blue (ocean). According to many, a Blue Ocean Event starts once Arctic sea ice extent falls below 1 million km².

The image on the right shows a trend pointing at zero Arctic sea ice volume by September 2027.

Note that the volume data in the image are averages for the month September ⁠— the minimum for each year is even lower. Furthermore, since zero volume implies zero extent, this indicates that a Blue Ocean Event (extent below 1 million km²) could happen well before 2027.

Sea ice extent

The image below, adapted from NSIDC, shows the extent of Arctic sea ice on July 26, 2022. 
[ click on images to enlarge ]

The extent of Arctic sea ice was among the lowest on record for the time of year on July 26, 2022. Furthermore, Antarctic sea ice extent is currently at a record low for the time of year, as illustrated by the image below, adapted from Vishop and showing the situation up to July 27, 2022. 


As a result, global extent of sea ice is close to record low for the time of year, as illustrated by the image below, adapted from Vishop and showing the situation up to July 27, 2022. 


Both Vishop and NSIDC use 15% concentration as the threshold for including an area in calculations of sea ice extent. This makes it important to look at the concentration of the sea ice. 

Sea ice concentration

The image below, adapted from University of Bremen, shows Arctic sea ice concentration on July 22, 2022, with concentration in many areas close to the North Pole down to 0%. 


The image below, adapted from NSIDC, shows Arctic sea ice concentration on July 26, 2022, with very low concentration of sea ice visible close to the North Pole. 


Sea ice thickness

The Naval Research Laboratory one-month animation below shows Arctic sea ice thickness up to July 25, 2022, with 8 days of forecasts added. 


The combination image below shows the fall in Arctic sea ice thickness from June 8 through August 6, 2022.

[ click on images to enlarge ]
The above combination image shows that most sea ice on June 8 (left) was forecast to be over 2 meters thick, that most sea ice on July 8 (center) was forecast to be over 1 meter thick, and that most sea was forecast to be under 1 meter thick on August 6, 2022 (right).

While the fall in extent over this period wasn't as dramatic, due to the suppression of air temperatures by the current La Niña, note that the green and yellow colors where the sea ice on June 8 was more than 2.5 meters thick, north of Greenland and north of the Canadian Arctic Archipelago, have virtually disappeared in the August 6 forecast.

The above maps show a dramatic fall in sea ice thickness over a large area. This fall in thickness is mostly due to warm water from the Atlantic Ocean that is melting the sea ice hanging underneath the surface. This is where the sea ice constitutes the latent heat buffer, consuming incoming heat in the process of melting.

The above Naval Research Laboratory maps may be conservative. The NASA Worldview and University of Bremen images below indicate that Arctic sea ice may be even thinner than that, especially north of the North Pole. 

The NASA Worldview combination image below shows the sea ice north of the North Pole on July 22, 2022 (left), and on July 23, 2022 (right), indicating that at many places there is no sea ice left at all. Note that the view in many places is obscured due to clouds. 


The University of Bremen combination image below shows the difference in sea ice thickness between June 1, 2022, June 30, 2022, and July 22, 2022. The images at the center and on the right show large areas where sea ice is less than 20 cm thick, indicating that the latent heat buffer had already disappeared in June 2022,  as also discussed further below. 

[ click on images to enlarge ]
The NASA Worldview combination image below shows the sea ice north of Greenland on July 19, 2022 (top), and on July 22, 2022 (bottom), indicating that even at places where the sea ice once was the thickest, it can melt away rapidly. The mechanism behind this is that, as thick ice breaks off and fragments, it additionally gets heated up from the sides, and this further accelerates the melting as the sea ice breaks up further, into ever smaller pieces.


The image below was created with a screenshot of a July 26, 2022, NASA Worldview satellite image, with the Earth at Night layer activated and brightness and contrast enhanced, which enables a closer look to be taken through the clouds. The image shows very little sea ice near the North Pole. 


The image below, a screenshot of a July 26, 2022, NASA Worldview satellite image, further shows that there is little sea ice close to the North Pole. 


Conditions behind the danger

One reason why sea ice has fallen so much in thickness so close to the North Pole is that around the time of the June Solstice (June 22, 2022) the North Pole receives more insolation than anywhere else on Earth.

Around this time of year, the sunlight has less distance to travel through the thinner atmosphere over the Arctic, so less sunlight gets absorbed or scattered before reaching the surface. In addition, the high angle of the Sun produces long days and sunlight is concentrated over a smaller area. Above the Arctic Circle, the Sun does not set at this time of year, so solar radiation continues all day and night.


How much sunlight does reach the surface further depends on weather conditions such as clouds and how much heat gets pushed by the wind toward the North Pole. As temperatures have risen over the years, the Jet Stream has become more deformed, increasing the chance that heatwaves over land extend over the Arctic Ocean. Deformation of the Jet Stream can also lead to increasingly strong winds speeding up ocean currents that can abruptly push huge amounts of ocean heat into the Arctic ocean, as further discussed below. For more background, also see the feedbacks page. 

Ocean heat

On July 19, 2022, the sea surface was as warm as 1.8°C or 35.2°F north of Greenland, as the nullschool.net image below shows. 


The above image also shows how cold water (blue) flows down to the east of Greenland, while warm water (green) flows off the west coast of Norway toward to Arctic Ocean, diving under the sea ice north of Svalbard and reaching areas north of Greenland where sea surface temperatures rise above freezing point. 

Of the extra heat from Earth's energy imbalance, about 93% ends up in the ocean as increasing ocean heat content (see image below), 3% goes into melting ice, 4% goes into raising temperatures of land and melting permafrost, and less than 1% remains in the atmosphere, as discussed in an earlier post.

[ from earlier post ]

Sea ice has disappeared in the Bering Strait, in part due to warm water from rivers in Alaska, as illustrated by the NOAA image below, which shows sea surface temperatures as high as 18.6°C or 65.48°F.


On July 19, 2022, the sea surface temperature anomaly from 1981-2011 in the Arctic Ocean was as high as 14.0°C or 25.2°F (at green circle), as illustrated by the screenshot below of a nullschool.net image (with text added). In 1981-2011, the sea surface temperature at this spot (at the green circle in the Kara Sea) at this time of year was around freezing point.


The above image also shows a distorted Jet Stream (at 250 hPa) moving over the Arctic ocean, instead of circumventing the Arctic and thus keeping heat out of the Arctic and keeping cold inside the Arctic, as it used to be.  


The above NOAA image illustrates how the Gulf Stream is pushing warm water toward the Arctic, with sea surface temperatures in the North Atlantic reaching as high as 32.6°C or 90.68°F on July 23, 2022.

Latent heat

Latent heat is heat that is (less and less) going into melting the sea ice. The reason this heat is called latent (hidden) heat, is that it doesn't raise the temperature of the water, but instead gets consumed in the process of melting the ice. Latent heat is energy associated with a phase change, such as the energy consumed when solid ice turns into water (i.e. melting). During a phase change, the temperature remains constant. Sea ice acts as a buffer that absorbs heat, while keeping the temperature at zero degrees Celsius. As long as there is sea ice in the water, this sea ice will keep absorbing heat, so the temperature doesn't rise at the sea surface. The amount of energy absorbed by melting ice is as much as it takes to heat an equivalent mass of water from zero to 80°C.


Once most of the sea ice that was hanging underneath the surface is gone, further heat will still keep moving underneath the sea ice from the Atlantic Ocean and - to a lesser extent - from the Pacific Ocean into the Arctic Ocean. Without the latent heat buffer, this heat must go elsewhere, i.e. it will typically raise the temperature of the water. The atmosphere will also warm up faster. More evaporation will occur once the sea ice is gone, further warming up the atmosphere.

A 2019 analysis concludes that the latent heat tipping point gets crossed when the sea surface temperature anomaly on the Northern Hemisphere gets higher than 1°C above 20th century's temperature and when there is little or no thick sea ice left. As the image below indicates, the temperature anomaly of 1°C above the 20th century average looks set to be crossed in the course of the year 2021.
As the Latent Heat Tipping Point gets crossed, there may still be a thin layer of ice at the surface, at least as long as air temperatures are low enough to keep it frozen and as long as strong winds haven't pushed the sea ice out of the Arctic Ocean. This thin layer of ice will still consume some ocean heat below the surface, but at the same time it acts as a seal, preventing heat from the Arctic Ocean to enter the atmosphere. Even if a lot of sea ice remains, the situation is dangerous, if not even more dangerous. The continuing La Niña could cause a lot of thin sea ice to remain at the surface of the Arctic Ocean this year. The more sea ice remains, the less ocean heat can be transferred from the Arctic Ocean to the atmosphere over the Arctic Ocean, which means that more heat remains in the Arctic Ocean.

One huge danger is that, as the buffer disappears that until now has consumed huge amounts of ocean heat, more heat will reach methane hydrates at the seafloor of the Arctic Ocean, causing them to get destabilized and resulting in releases of methane from these hydrates and from free gas underneath that was previously sealed by the hydrates.

As the latent heat buffer of the sea ice underneath the surface disappears, more of this heat could then reach sediments at the seafloor of the Arctic Ocean, threatening eruptions to occur of seafloor methane (from hydrates and from free gas underneath the hydrates). The methane could similarly push up temperatures dramatically over the Arctic, and globally over the next few years.

[ feedback #14: Latent Heat ]

The above 2014 image, from the feedbacks page, shows three of the numerous feedbacks that are accelerating warming in the Arctic. Feedback #1 is the albedo feedback. Feedback #14 refers to the loss of the Latent Heat Buffer and warming of the Arctic Ocean. Feedback #2 refers to methane releases.

Heatwaves look set to continue on the Northern Hemisphere, extending heat over the Arctic Ocean and thus affecting Arctic sea ice from above, while warm water from rivers will cause more melting at the surface, and while rising ocean heat will continue to cause more melting of the ice underneath the surface. If this continues, we can expect a new record low for sea ice in September 2022 and the joint loss of the latent heat buffer and the loss of albedo could push up temperatures dramatically over the Arctic, while the additional methane could similarly push up temperatures dramatically over the Arctic, and globally over the next few years.

[ The Buffer has gone, feedback #14 on the Feedbacks page ]
As discussed at the albedo page and the feedbacks page, albedo change, loss of the latent heat buffer and changes to the Jet Stream are important feedbacks. 


The above image, adapted from an ECMWF.int forecast for July 29, 2022, 12 UTC, run at that time, shows virtually no snow and ice cover over land except Greenland. The image also shows the difference such cover or the lack thereof makes in albedo. 

[ click on images to enlarge ]
The above image, adapted from NOAA Coral Bleaching Heat Stress Monitoring, shows expected coral bleaching heat stress for August to November 2022. The image on the right shows that coral bleaching alert level 2 was reached in the Barents Sea (green circle) on July 29, 2022, while a distorted Jet Stream is pushing warm, salty water from the Atlantic Ocean into the Arctic Ocean. 

2022 study of the Blob, a warm water area in the North Pacific that began in late 2013, concludes that the unusually warm waters were transported northward from further south. The researchers found that abnormally warm temperatures extended 1,000 meters (3,280 feet) below the surface.


The above image shows the Blob on July 24, 2022, with sea surface temperature anomalies as high as 10.5°C or 18.8°F on July 24, 2022. The North Pacific Current is visible, extending eastward from the coast of Japan.

Arctic-news has long (e.g. in this 2017 post) warned that changes to the Jet Stream can strengthen storms that can in turn cause a large amount of warm, salty water to abruptly move north and enter the Arctic Ocean from the Atlantic Ocean and trigger destabilization of methane hydrates at the seafloor of the Arctic Ocean, resulting in eruption of huge amounts of methane that could drive humans into extinction in a matter of years. 


Conclusion

In conclusion, temperatures could rise strongly in the Arctic soon, due to sea ice loss in combination with feedbacks and an upcoming El Niño coinciding with a peak in sunspots, with the potential to drive humans extinct as early as in 2025, while temperatures would continue to skyrocket in 2026, making it in many respects rather futile to speculate about what will happen beyond 2026. At the same time, the right thing to do now is to help avoid the worst things from happening, through comprehensive and effective action as described in the Climate Plan.


Links

• Blue Ocean Event
https://arctic-news.blogspot.com/p/blue-ocean-event.html

• National Snow and Ice Data Center (NSIDC)
https://nsidc.org

• Visualization Service of Horizontal scale Observations at Polar region (Vishop) 
https://ads.nipr.ac.jp/vishop/#/extent

• Naval Research Laboratory
https://www7320.nrlssc.navy.mil/GLBhycomcice1-12/arctic.html

• University of Bremen
https://seaice.uni-bremen.de/databrowser

• NASA Worldview satellite
https://worldview.earthdata.nasa.gov

• NOAA - sea surface temperature

• Human Extinction by 2025?