Blue Ocean Event
 |
| [ from Blue Ocean Event ] |
The image on the right shows a trend pointing at zero Arctic sea ice volume by September 2027.
Note that the volume data in the image are averages for the month September — the minimum for each year is even lower. Furthermore, since zero volume implies zero extent, this indicates that a Blue Ocean Event (extent below 1 million km²) could happen well before 2027.
Sea ice extent
The image below, adapted from NSIDC, shows the extent of Arctic sea ice on July 26, 2022.
 |
| [ click on images to enlarge ] |

As a result, global extent of sea ice is close to record low for the time of year, as illustrated by the image below, adapted from Vishop and showing the situation up to July 27, 2022.

Both Vishop and NSIDC use 15% concentration as the threshold for including an area in calculations of sea ice extent. This makes it important to look at the concentration of the sea ice.
Sea ice concentration
The image below, adapted from University of Bremen, shows Arctic sea ice concentration on July 22, 2022, with concentration in many areas close to the North Pole down to 0%.

The image below, adapted from NSIDC, shows Arctic sea ice concentration on July 26, 2022, with very low concentration of sea ice visible close to the North Pole.

The Naval Research Laboratory one-month animation below shows Arctic sea ice thickness up to July 25, 2022, with 8 days of forecasts added.

 |
| [ click on images to enlarge ] |
While the fall in extent over this period wasn't as dramatic, due to the suppression of air temperatures by the current La Niña, note that the green and yellow colors where the sea ice on June 8 was more than 2.5 meters thick, north of Greenland and north of the Canadian Arctic Archipelago, have virtually disappeared in the August 6 forecast.
The above Naval Research Laboratory maps may be conservative. The NASA Worldview and University of Bremen images below indicate that Arctic sea ice may be even thinner than that, especially north of the North Pole.

The University of Bremen combination image below shows the difference in sea ice thickness between June 1, 2022, June 30, 2022, and July 22, 2022. The images at the center and on the right show large areas where sea ice is less than 20 cm thick, indicating that the latent heat buffer had already disappeared in June 2022, as also discussed further below.
 |
| [ click on images to enlarge ] |
The NASA Worldview combination image below shows the sea ice north of Greenland on July 19, 2022 (top), and on July 22, 2022 (bottom), indicating that even at places where the sea ice once was the thickest, it can melt away rapidly. The mechanism behind this is that, as thick ice breaks off and fragments, it additionally gets heated up from the sides, and this further accelerates the melting as the sea ice breaks up further, into ever smaller pieces.

The image below was created with a screenshot of a July 26, 2022, NASA Worldview satellite image, with the Earth at Night layer activated and brightness and contrast enhanced, which enables a closer look to be taken through the clouds. The image shows very little sea ice near the North Pole.

The image below, a screenshot of a July 26, 2022, NASA Worldview satellite image, further shows that there is little sea ice close to the North Pole.

Conditions behind the danger
Around this time of year, the sunlight has less distance to travel through the thinner atmosphere over the Arctic, so less sunlight gets absorbed or scattered before reaching the surface. In addition, the high angle of the Sun produces long days and sunlight is concentrated over a smaller area. Above the Arctic Circle, the Sun does not set at this time of year, so solar radiation continues all day and night.

How much sunlight does reach the surface further depends on weather conditions such as clouds and how much heat gets pushed by the wind toward the North Pole. As temperatures have risen over the years, the Jet Stream has become more deformed, increasing the chance that heatwaves over land extend over the Arctic Ocean. Deformation of the Jet Stream can also lead to increasingly strong winds speeding up ocean currents that can abruptly push huge amounts of ocean heat into the Arctic ocean, as further discussed below. For more background, also see the feedbacks page.
Ocean heat
On July 19, 2022, the sea surface was as warm as 1.8°C or 35.2°F north of Greenland, as the nullschool.net image below shows.

The above image also shows how cold water (blue) flows down to the east of Greenland, while warm water (green) flows off the west coast of Norway toward to Arctic Ocean, diving under the sea ice north of Svalbard and reaching areas north of Greenland where sea surface temperatures rise above freezing point.
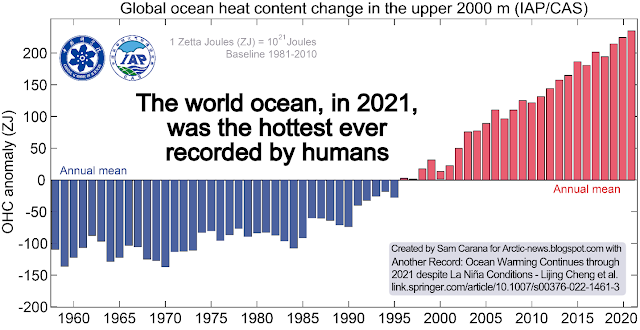
Of the extra heat from Earth's energy imbalance, about 93% ends up in the ocean as increasing ocean heat content (see image below), 3% goes into melting ice, 4% goes into raising temperatures of land and melting permafrost, and less than 1% remains in the atmosphere, as discussed in an earlier post.
 |
| [ from earlier post ] |
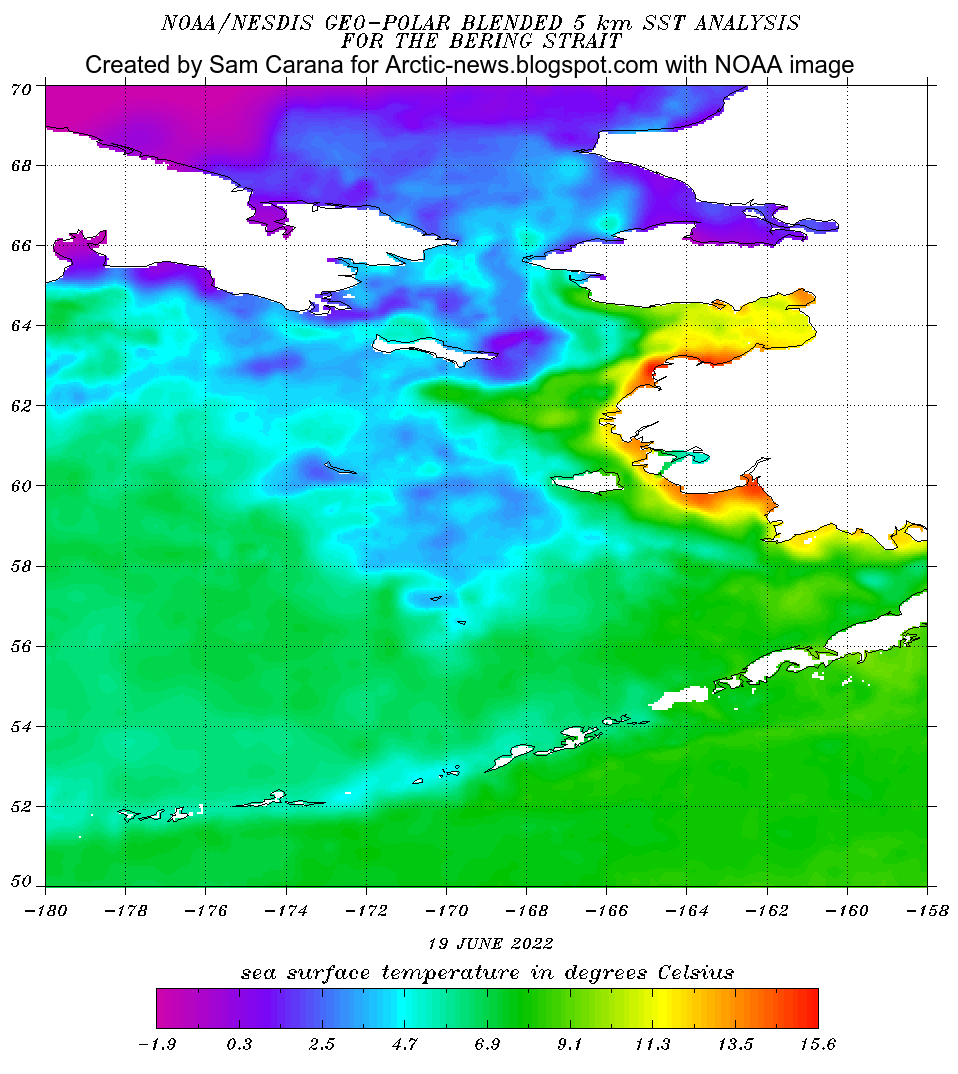
Sea ice has disappeared in the Bering Strait, in part due to warm water from rivers in Alaska, as illustrated by the NOAA image below, which shows sea surface temperatures as high as 18.6°C or 65.48°F.
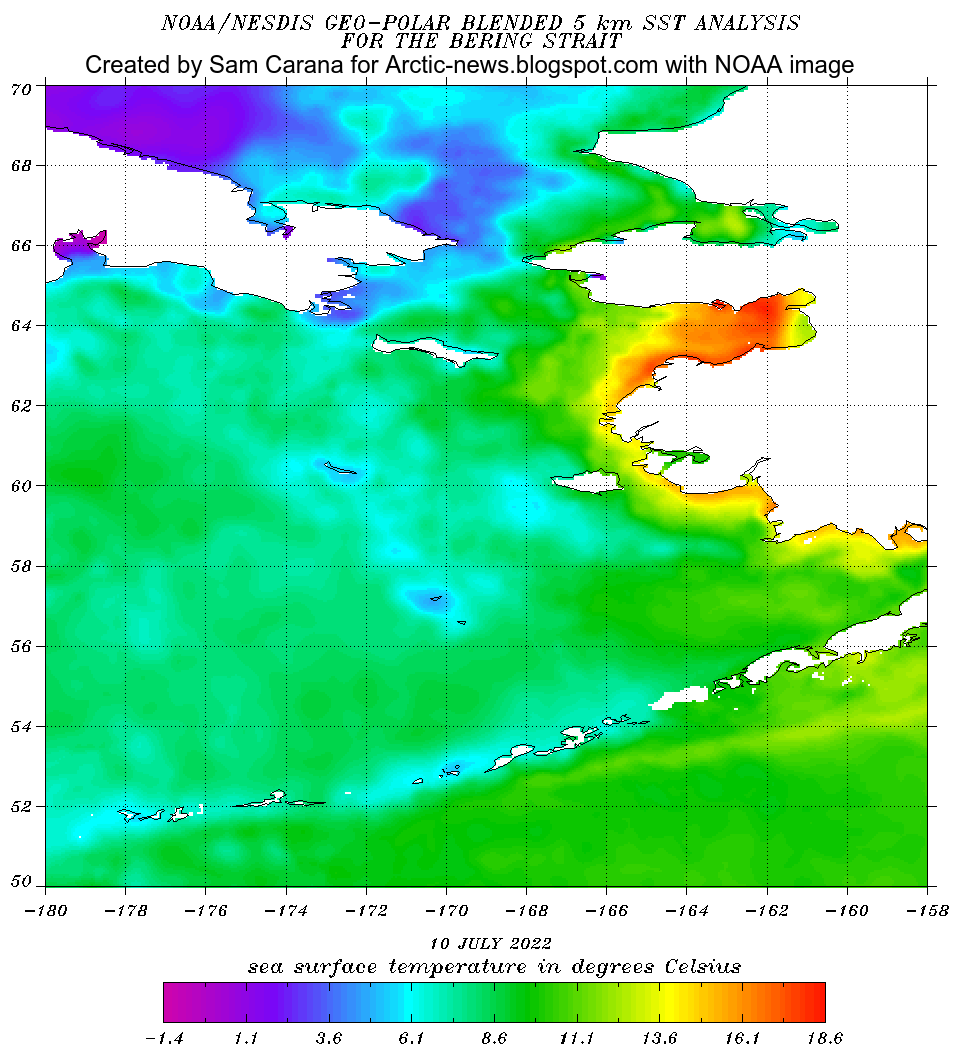

The above image also shows a distorted Jet Stream (at 250 hPa) moving over the Arctic ocean, instead of circumventing the Arctic and thus keeping heat out of the Arctic and keeping cold inside the Arctic, as it used to be.

The above NOAA image illustrates how the Gulf Stream is pushing warm water toward the Arctic, with sea surface temperatures in the North Atlantic reaching as high as 32.6°C or 90.68°F on July 23, 2022.
Latent heat
Latent heat is heat that is (less and less) going into melting the sea ice. The reason this heat is called latent (hidden) heat, is that it doesn't raise the temperature of the water, but instead gets consumed in the process of melting the ice. Latent heat is energy associated with a phase change, such as the energy consumed when solid ice turns into water (i.e. melting). During a phase change, the temperature remains constant. Sea ice acts as a buffer that absorbs heat, while keeping the temperature at zero degrees Celsius. As long as there is sea ice in the water, this sea ice will keep absorbing heat, so the temperature doesn't rise at the sea surface. The amount of energy absorbed by melting ice is as much as it takes to heat an equivalent mass of water from zero to 80°C.

Once most of the sea ice that was hanging underneath the surface is gone, further heat will still keep moving underneath the sea ice from the Atlantic Ocean and - to a lesser extent - from the Pacific Ocean into the Arctic Ocean. Without the latent heat buffer, this heat must go elsewhere, i.e. it will typically raise the temperature of the water. The atmosphere will also warm up faster. More evaporation will occur once the sea ice is gone, further warming up the atmosphere.
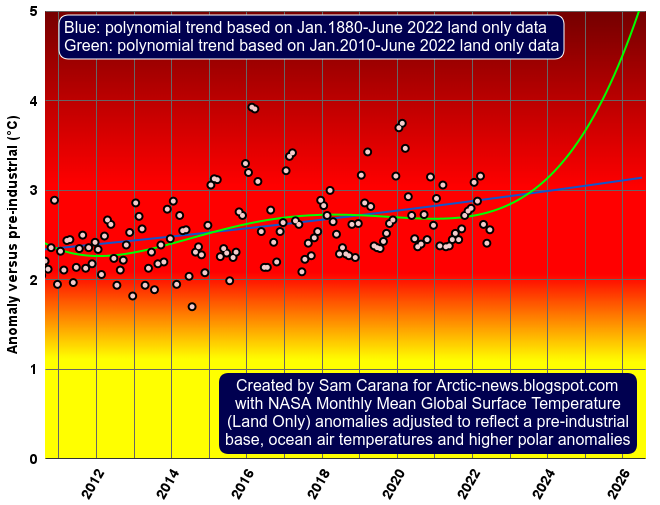
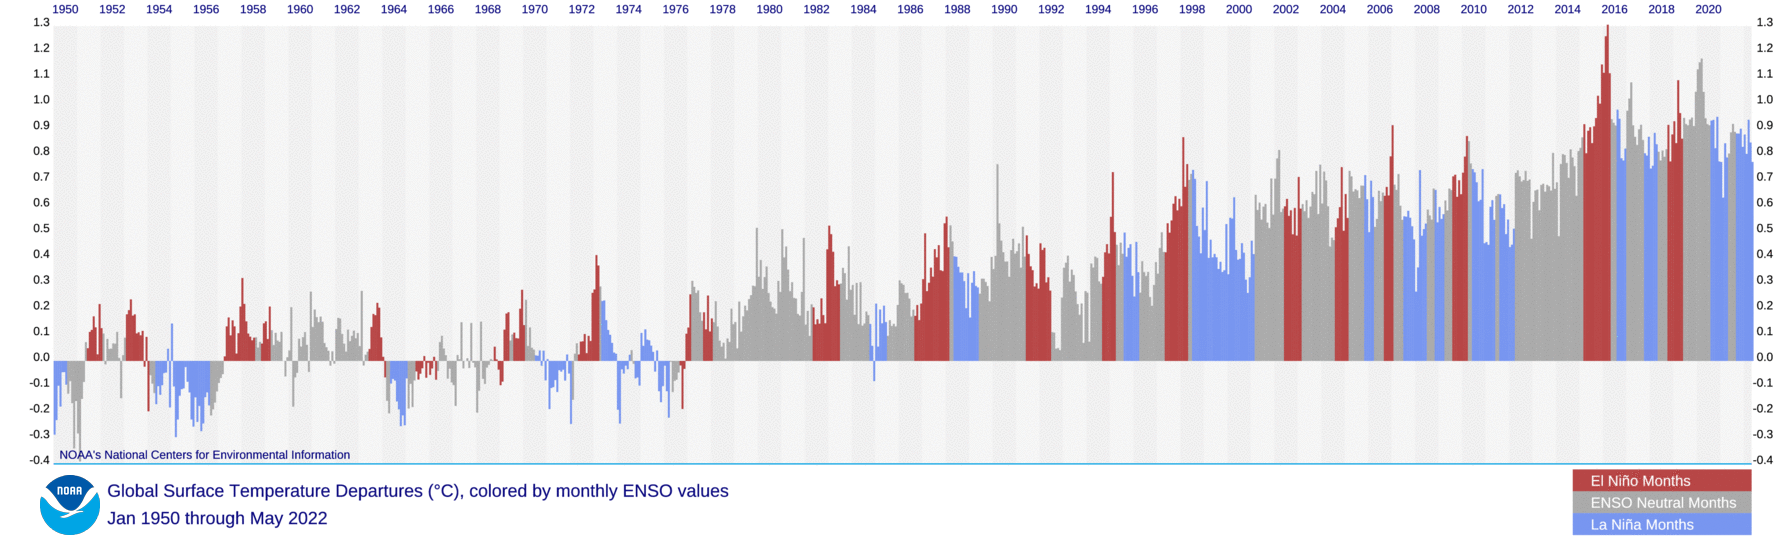
A 2019 analysis concludes that the latent heat tipping point gets crossed when the sea surface temperature anomaly on the Northern Hemisphere gets higher than 1°C above 20th century's temperature and when there is little or no thick sea ice left. As the image below indicates, the temperature anomaly of 1°C above the 20th century average looks set to be crossed in the course of the year 2021.
 |
| [ from the post Arctic Ocean invaded by hot, salty water ] |
As the Latent Heat Tipping Point gets crossed, there may still be a thin layer of ice at the surface, at least as long as air temperatures are low enough to keep it frozen and as long as strong winds haven't pushed the sea ice out of the Arctic Ocean. This thin layer of ice will still consume some ocean heat below the surface, but at the same time it acts as a seal, preventing heat from the Arctic Ocean to enter the atmosphere. Even if a lot of sea ice remains, the situation is dangerous, if not even more dangerous. The continuing La Niña could cause a lot of thin sea ice to remain at the surface of the Arctic Ocean this year. The more sea ice remains, the less ocean heat can be transferred from the Arctic Ocean to the atmosphere over the Arctic Ocean, which means that more heat remains in the Arctic Ocean.
One huge danger is that, as the buffer disappears that until now has consumed huge amounts of ocean heat, more heat will reach methane hydrates at the seafloor of the Arctic Ocean, causing them to get destabilized and resulting in releases of methane from these hydrates and from free gas underneath that was previously sealed by the hydrates.
As the latent heat buffer of the sea ice underneath the surface disappears, more of this heat could then reach sediments at the seafloor of the Arctic Ocean, threatening eruptions to occur of seafloor methane (from hydrates and from free gas underneath the hydrates). The methane could similarly push up temperatures dramatically over the Arctic, and globally over the next few years.
The above 2014 image, from the feedbacks page, shows three of the numerous feedbacks that are accelerating warming in the Arctic. Feedback #1 is the albedo feedback. Feedback #14 refers to the loss of the Latent Heat Buffer and warming of the Arctic Ocean. Feedback #2 refers to methane releases. One huge danger is that, as the buffer disappears that until now has consumed huge amounts of ocean heat, more heat will reach methane hydrates at the seafloor of the Arctic Ocean, causing them to get destabilized and resulting in releases of methane from these hydrates and from free gas underneath that was previously sealed by the hydrates.
As the latent heat buffer of the sea ice underneath the surface disappears, more of this heat could then reach sediments at the seafloor of the Arctic Ocean, threatening eruptions to occur of seafloor methane (from hydrates and from free gas underneath the hydrates). The methane could similarly push up temperatures dramatically over the Arctic, and globally over the next few years.
 |
| [ feedback #14: Latent Heat ] |
Heatwaves look set to continue on the Northern Hemisphere, extending heat over the Arctic Ocean and thus affecting Arctic sea ice from above, while warm water from rivers will cause more melting at the surface, and while rising ocean heat will continue to cause more melting of the ice underneath the surface. If this continues, we can expect a new record low for sea ice in September 2022 and the joint loss of the latent heat buffer and the loss of albedo could push up temperatures dramatically over the Arctic, while the additional methane could similarly push up temperatures dramatically over the Arctic, and globally over the next few years.


The above image shows the Blob on July 24, 2022, with sea surface temperature anomalies as high as 10.5°C or 18.8°F on July 24, 2022. The North Pacific Current is visible, extending eastward from the coast of Japan.
Conclusion
In conclusion, temperatures could rise strongly in the Arctic soon, due to sea ice loss in combination with feedbacks and an upcoming El Niño coinciding with a peak in sunspots, with the potential to drive humans extinct as early as in 2025, while temperatures would continue to skyrocket in 2026, making it in many respects rather futile to speculate about what will happen beyond 2026. At the same time, the right thing to do now is to help avoid the worst things from happening, through comprehensive and effective action as described in the Climate Plan.
Links
• Blue Ocean Event
https://arctic-news.blogspot.com/p/blue-ocean-event.html
• National Snow and Ice Data Center (NSIDC)
https://nsidc.org
• Visualization Service of Horizontal scale Observations at Polar region (Vishop)
 |
| [ The Buffer has gone, feedback #14 on the Feedbacks page ] |
As discussed at the albedo page and the feedbacks page, albedo change, loss of the latent heat buffer and changes to the Jet Stream are important feedbacks.

The above image, adapted from an ECMWF.int forecast for July 29, 2022, 12 UTC, run at that time, shows virtually no snow and ice cover over land except Greenland. The image also shows the difference such cover or the lack thereof makes in albedo.
 |
| [ click on images to enlarge ] |

The above image, adapted from NOAA Coral Bleaching Heat Stress Monitoring, shows expected coral bleaching heat stress for August to November 2022. The image on the right shows that coral bleaching alert level 2 was reached in the Barents Sea (green circle) on July 29, 2022, while a distorted Jet Stream is pushing warm, salty water from the Atlantic Ocean into the Arctic Ocean.
A 2022 study of the Blob, a warm water area in the North Pacific that began in late 2013, concludes that the unusually warm waters were transported northward from further south. The researchers found that abnormally warm temperatures extended 1,000 meters (3,280 feet) below the surface.

Arctic-news has long (e.g. in this 2017 post) warned that changes to the Jet Stream can strengthen storms that can in turn cause a large amount of warm, salty water to abruptly move north and enter the Arctic Ocean from the Atlantic Ocean and trigger destabilization of methane hydrates at the seafloor of the Arctic Ocean, resulting in eruption of huge amounts of methane that could drive humans into extinction in a matter of years.
In conclusion, temperatures could rise strongly in the Arctic soon, due to sea ice loss in combination with feedbacks and an upcoming El Niño coinciding with a peak in sunspots, with the potential to drive humans extinct as early as in 2025, while temperatures would continue to skyrocket in 2026, making it in many respects rather futile to speculate about what will happen beyond 2026. At the same time, the right thing to do now is to help avoid the worst things from happening, through comprehensive and effective action as described in the Climate Plan.
Links
• Blue Ocean Event
https://arctic-news.blogspot.com/p/blue-ocean-event.html
• National Snow and Ice Data Center (NSIDC)
https://nsidc.org
• Visualization Service of Horizontal scale Observations at Polar region (Vishop)
https://ads.nipr.ac.jp/vishop/#/extent
• Naval Research Laboratory
https://www7320.nrlssc.navy.mil/GLBhycomcice1-12/arctic.html
• University of Bremen
https://seaice.uni-bremen.de/databrowser
• NASA Worldview satellite
https://worldview.earthdata.nasa.gov
• NOAA - sea surface temperature
• Human Extinction by 2025?
• Naval Research Laboratory
https://www7320.nrlssc.navy.mil/GLBhycomcice1-12/arctic.html
• University of Bremen
https://seaice.uni-bremen.de/databrowser
• NASA Worldview satellite
https://worldview.earthdata.nasa.gov
• NOAA - sea surface temperature
https://www.ospo.noaa.gov/Products/ocean/sst/contour/index.html
• nullschool
https://earth.nullschool.net
• Jet Stream
https://arctic-news.blogspot.com/p/jet-stream.html
• Albedo, latent heat, insolation and more
https://arctic-news.blogspot.com/p/albedo.html
• Insolation
https://arctic-news.blogspot.com/p/insolation.html
• Latent Heat Buffer
https://arctic-news.blogspot.com/p/latent-heat.html
• Jet Stream
https://arctic-news.blogspot.com/p/jet-stream.html
• Feedbacks in the Arctic
https://arctic-news.blogspot.com/p/feedbacks.html
• Sunspots
https://arctic-news.blogspot.com/p/sunspots.html
• Cataclysmic Alignment
• Human Extinction by 2025?
https://arctic-news.blogspot.com/2022/07/human-extinction-by-2025.html
• Extinction
https://arctic-news.blogspot.com/p/extinction.html
• Climate Plan
https://arctic-news.blogspot.com/p/climateplan.html
• Extinction
https://arctic-news.blogspot.com/p/extinction.html
• Climate Plan
https://arctic-news.blogspot.com/p/climateplan.html


