Monday, December 31, 2012

How to avoid mass-scale death, destruction and extinction

The image below shows the FAO Food Price Index (Cereals), updated to October 2012.

[ image from earlier post ]

The above FAO Food Price Index shows that high food prices have been around for the past few years. The FAO, in its recent Cereal Supply and Demand Brief, explains that we can expect prices to rise, as illustrated below.


The Economic Research Service of the U.S. Department of Agriculture mentions, in its Food Price Outlook, 2012-2013, that the "drought has affected prices for corn and soybeans as well as other field crops which should, in turn, drive up retail food prices".

Global food supply is under stress as extreme weather becomes the new norm. Farmers may be inclined to respond to drought by overusing ground water, or by slashing and burning forest, in efforts to create more farmland. Such practices do not resolve the problems; instead, they tend to exacerbate the problems over time, making things progressively worse.

The diagram below shows that there are many climatological feedbacks (ten of which are pictured) that make climate change worse. At the top, the diagram pictures vicious cycles that are responses by farmers that can add to make the situation even worse. Without effective action, the prospect is that climate change and crop failure combine to cause mass death and destruction, with extinction becoming the fourth development of global warming.

How can we avoid that such a scenario will eventuate? Obviously, once we are in the fourth development, i.e. mass-scale famine and extintion, it will be too late for action. Similarly, if the world moves into the third development, i.e. runaway global warming, it will be hard, if not impossible to reverse such a development. Even if we act now, it will be hard to reverse the second development, i.e. accelerated warming in the Arctic.

The most effective action will target causes rather than symptoms of these developments.

Part 1. Since emissions are the cause of global warming, dramatic cuts in emissions should be included in the first part of the responses. In addition, action is needed to remove excess carbon dioxide from the atmosphere and oceans. Storing the carbon in the soil will also improve soil quality, as indicated by the long green arrow on the left.

Part 2. Solar radiation management is needed to cool the Arctic.

Part 3. Methane management and further action is needed, e.g. to avoid that methane levels will rise further in the Arctic, which threatens to trigger further releases and escalate into runaway global warming. Measures to reduce methane can also benefit soil quality worldwide, as indicated by the long green arrow on the right.

Thus, the proposed action tackles the prospect of mass death and extinction by increasing soil fertility, as illustrated by the image below.


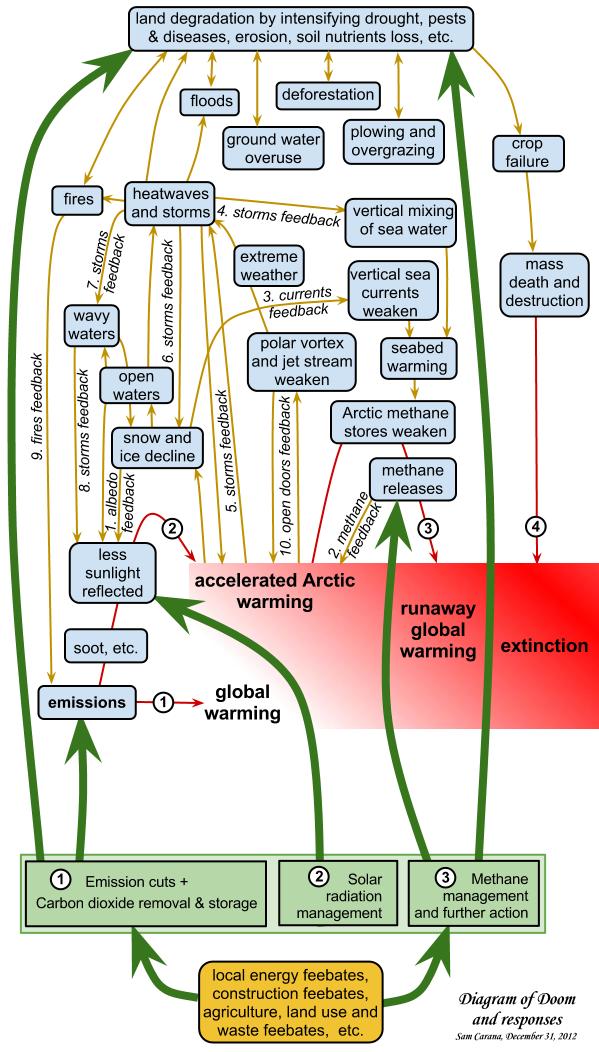
As indicated at the bottom of the image, the most effective policies to accomplish the goals set out in both part 1. and part 3. are feebates, preferably implemented locally.

Sunday, December 30, 2012

High methane levels persist in December 2012

The image below was posted earlier at Methane contributes to accelerated warming in the Arctic. As mentioned there, this is a compilation of images produced by Dr. Leonid Yurganov, comparing methane levels between November 21-30, 2008 (below left), and November 21-30, 2012 (below right).


Dr. Yurganov has released two further images this year, i.e. for December 1-10, 2012 (below left), and for December 11-20, 2012 (below right).


The images show that the highest methane levels show up above the water, as opposed to above land, indicating that methane is being released from the seabed across the Arctic. The images further show that high levels of methane persist in December 2012.

Apart from comparing 10-day periods, we can also look at methane levels for individual days. The NOAA image below shows methane levels up to 2167 ppb on December 27, 2012, for the morning set of measurements.

To better see where the high (yellow) levels of methane were measured, a map with empty data is added below, showing the location of the continents more clearly on the map.


Pressure levels at which measurements are taken are displayed in hectopascals (symbol hPa) which are numerically equivalent to millibars (mb). A pressure of 600 mb (or hPa) corresponds with an altitude of 13794.9 ft (4204.7 m). By comparison, air pressure at mean sea level is 1013.25 hPa (millibar), or 29.92 inches of mercury.

The map below, from apocalypse4realmethane2012, shows methane measurements taken on the same day (December 27, 2012, morning set), but at 718 mb, which corresponds with an altitude that is a bit closer down to sea level. The map focuses on the Arctic and shows geographic names. If you like, click on the map to enlarge it.


Methane measurements were taken with the IASI (Infrared Atmospheric Sounding Interferometer) instrument, fitted onto the European Space Agencys (ESA) MetOp series of polar orbiting satellites.


For further analysis, the NOAA image with surface temperature anomalies for December 28, 2012, is added above, showing anomalies up to 20 degrees Celsius. Furthermore, the NOAA image with sea surface temperature anomalies for December 27, 2012, is added below, showing anomalies up to 5 degrees Celsius.

Friday, December 28, 2012

Albedo changes in the Arctic

How global warming and feedbacks are causing huge albedo changes in the Arctic.

Snow cover decline

Decline of the snow cover on land in the northern hemisphere is accelerating, as illustrated by the image below and the image underneath on the right. (1)


Image credit: Rutgers University
Fresh snow can have an albedo as high as 0.85, meaning that up to 85% of the sunlight falling on snow can get reflected back into space. As the snow melts, its structure changes making it less reflective, i.e. its albedo will go down, to as low as 40%. (2)

As a result, more sunlight gets absorbed, accelerating the melting process. Eventually, where snow melts away, spots of bare soil become exposed, and dark wet soil has a very low albedo, reflecting only between 5% and 15% of the sunlight. Thus, even more sunlight gets absorbed and the soil's temperature increases, causing more of the remaining snow to melt. (2)

Changes in vegetation can further accelerate this process. Russia's boreal forest - the largest continuous expanse of forest in the world - has seen a transformation in recent years from larch to conifer trees. Larch trees drop their needles in the fall, allowing the vast, snow-covered ground in winter to reflect sunlight and heat back into space and helping to keep temperatures in the region very cold. But conifers such as spruce and fir retain their needles, which absorb sunlight and increase the forest's ground-level heat retention. (3)

Albedo, from Wikipedia
A conversion from larch to evergreen stands in low-diversity regions of southern Siberia would generate a local positive radiative forcing of 5.1±2.6 W m−2. This radiative heating would reinforce the warming projected to occur in the area under climate change. (4)

Tundra in the Arctic used to be covered by a white blanket of snow most of the year. However, as the landscape is warming up, more trees and shrubs appear. Scientists who studied part of the Eurasian Arctic, found that willow and alder shrubs, once stunted by harsh weather, have been growing upward to the height of trees in recent decades. They now rise above the snowfall, presenting a dark, light-absorbing surface. This increased absorption of the Sun's radiation, combined with microclimates created by forested areas, adds to global warming, making an already-warming climate warm even more rapidly. (5 & 6)

Furthermore, encroachment of trees onto Arctic tundra caused by the warming may cause large release of carbon to the atmosphere, concludes a recent study. This is because tundra soil contains a lot of stored organic matter, due to slow decomposition, but the trees stimulate the decomposition of this material. (7)


Sea ice decline

In the Arctic, sea ice volume has fallen dramatically over the years, as illustrated by the image on the right. The trend points at 2014 as the year when Arctic sea ice will first reach zero volume for some time during that year. (8)

The Arctic Ocean looks set to be ice-free for a period of at least three months in 2015 (August, September and October), and for a period of at least 6 months from the year 2020 (June through to November). (9)

Decline of the Arctic sea ice is accelerating, due to numerous feedbacks. As the Arctic atmosphere warms up, any snow cover on top of the ice will melt away ever quickly, decreasing the surface albedo and thus reinforcing the warm-up. As melt ponds appear on top of the ice, the albedo will drop even further.

Sam Carana's Diagram of Doom pictures ten feedbacks that jointly work to accelerate sea ice decline. (10)

The image below shows the three areas where albedo change will be felt most in the Arctic, i.e. sea ice loss, decline of albedo in Greenland and more early and extensive retreat of snow and ice cover in other areas in the Arctic. (8)

Big changes in the Arctic within years, by Sam Carana


References

1. Northern Hemisphere Snow Cover Anomalies 1967-2012 June, Rutgers University
climate.rutgers.edu/snowcover/chart_anom.php?ui_set=1&ui_region=nhland&ui_month=6

2. Albedo, Albedo Change blog
albedochange.blogspot.com/2009/02/albedo-change.html

3. Shift in Northern Forests Could Increase Global Warming, Scientific American, March 28, 2011
scientificamerican.com/article.cfm?id=shift-northern-forests-increase-global-warming

4. Sensitivity of Siberian larch forests to climate change, Shuman et al., April 5, 2011, Wiley.com
onlinelibrary.wiley.com/doi/10.1111/j.1365-2486.2011.02417.x/abstract

5. Warming turns tundra to forest
ox.ac.uk/media/news_stories/2012/120604.html

6. Eurasian Arctic greening reveals teleconnections and the potential for structurally novel ecosystems, Macias-Fauria et al., 2012
nature.com/nclimate/journal/v2/n8/full/nclimate1558.html

7. Expansion of forests in the European Arctic could result in the release of carbon dioxide, University of Exeter news, June 18, 2012
exeter.ac.uk/news/featurednews/title_214902_en.html

8. Big changes in the Arctic within years, Sam Carana, October 26, 2012, Arctic-News blog
arctic-news.blogspot.com/2012/10/big-changes-in-arctic-within-years.html

9. Getting the Picture, Sam Carana, August 2012, Arctic-News blog
arctic-news.blogspot.com/2012/08/getting-the-picture.html

10. Diagram of Doom, Sam Carana, August 2012, Arctic-News blog
arctic-news.blogspot.com/2012/08/diagram-of-doom.html


Further reading

- Albedo change in the Arctic
arctic-news.blogspot.com/2012/07/albedo-change-in-arctic.html

- Greenland is melting at incredible rate
arctic-news.blogspot.com/2012/07/greenland-is-melting-at-incredible-rate.html

- Albedo change in the Arctic threatens to cause runaway global warming
arctic-news.blogspot.com/2012/10/albedo-change-in-the-arctic-threatens-to-cause-runaway-global-warming.html

Friday, December 21, 2012

Methane contributes to accelerated warming in the Arctic


Above combination image featured earlier in the post Striking increase of methane in the Arctic. The images were produced by Dr. Leonid Yurganov, Senior Research Scientist, JCET, UMBC, who presented his findings at the AGU Fall Meeting 2012. The image below gives an update for 2012, showing an image with methane levels at 600 hPa.


Temperature anomalies on the inset on above image are averages for the full month November, whereas the methane levels displayed on the left are for the first ten days of November only. Using temperature maps for the same periods in such comparisons may result in even more striking simularities between methane levels and temperatures. For a more complete picture, further comparisons between November 2008 and November 2012 are added, for days 11-20 (below),


and for days 21-30 (below).


The images show that the highest methane levels show up above the water, as opposed to above land, indicating that methane is being released from the seabed across the Arctic.

Temperatures have meanwhile changed. In November 2012, there were high temperature anomalies in east Siberia. There now are very low temperatures throughout Siberia, as illustrated by the Wunderground map below, which shows high temperatures. Temperatures as low as -60.5°F (-51.4°C) were recorded in Susuman, east Siberia, both on December 13th and 17th, 2012.


The now hugely deformed polar jet stream and high levels of methane in the Arctic are only two out of numerous feedbacks that contribute to accelerate warming in the Arctic. Without rapid action, we can expect such wild swings in temperature to get even worse, making more extreme weather the new norm.