Showing posts sorted by relevance for query methane plume. Sort by date Show all posts

Tuesday, September 25, 2012

Expedition to study methane gas bubbling out of the Arctic seafloor

The black rectangle on this map shows the general region
where Paull and his collaborators have been studying
methane releases in the Beaufort Sea. The smaller red
rectangle indicates the edge of the continental shelf and
continental slope where they will conduct research during t
heir current expedition. These areas are shown in greater
detail in the maps below. Base image: Google Maps
Chasing gas bubbles in the Beaufort Sea

In the remote, ice-shrouded Beaufort Sea, methane (the main component of natural gas) has been bubbling out of the seafloor for thousands of years. MBARI geologist Charlie Paull and his colleagues at the Geological Survey of Canada are trying to figure out where this gas is coming from, how fast it is bubbling out of the sediments, and how it affects the shape and stability of the seafloor. Although Paull has been studying this phenomenon for a decade, his research has taken on new urgency in recent years, as the area is being eyed for oil and gas exploration.

In late September 2012, Paull and his fellow researchers will spend two weeks in the Beaufort Sea on board the Canadian Coast Guard ship Sir Wilfred Laurier, collecting seafloor sediment, mapping the seafloor using sonar, installing an instrument that will "listen" for undersea gas releases, and using a brand new undersea robot to observe seafloor features and collect gas samples.

This will be Paull's third Beaufort Sea expedition. As in previous expeditions, he will be working closely with Scott Dallimore of Natural Resources Canada's Geological Survey of Canada and Humfrey Melling of Fisheries and Oceans Canada's Institute of Ocean Sciences.

Paull's work in the Arctic started in 2003, with an investigation into the enigmatic underwater hills called "pingo-like features" (PLFs) that rise out of the continental shelf of the Beaufort Sea. (Pingos are isolated conical hills found on land in some parts of the Arctic and subarctic.)

Over time, the focus of the team's research has moved farther offshore, into deeper water. Their second expedition in 2010 looked at diffuse gas venting along the seaward edge of the continental shelf. The 2012 expedition will focus on three large gas-venting structures on the continental slope, at depths of 290 to 790 meters (950 to 2,600 feet).

This idealized cross section of the continental shelf and
continental slope in the Beaufort Sea shows zones in the
seafloor where permafrost and methane hydrate are
likely to exist, as well as hypothetical locations of methane
seeps on the seafloor. Ocean depths not shown to scale.
Image: © 2012 MBARI
Frozen gas—a relict of previous ice ages

The Beaufort Sea, north of Canada's Yukon and Northwest Territories, is a hostile environment by any definition of the term. It is covered with ice for much of the year. Historically, only from mid-July to October has a narrow strip of open water appeared within about 50 to 100 kilometers (30 to 60 miles) of the coast. Even at this time of year, winds often howl at 40 knots and temperatures can drop well below freezing at night. Researchers must allow extra time for contingencies such dodging pack ice and having to shovel snow off the deck of the research vessel.

Average annual air temperatures along the coast of the Beaufort Sea are well below freezing. Thus deeper soils remain permanently frozen throughout the year, forming what is called permafrost. Around the Beaufort Sea, permafrost extends more than 600 meters (about 2,000 feet) below the ground.

Permafrost also exists in the sediments underlying the continental shelf of Beaufort Sea. This permafrost is a relict of the last ice age, when sea level was as much as 120 meters lower than today. At that time, areas that are now covered with seawater were exposed to the frigid Arctic air.

As sea-level rose over the last 10,000 years, it flooded the continental shelf with seawater. Although the water in the Beaufort Sea is cold—about minus 1.5 degrees Centigrade—it is still much warmer than the air, which averages minus 15 degrees C. Thus, as the ocean rose, it is gradually warmed up the permafrost beneath the continental shelf, causing it to melt.

Quite a bit of methane, the main component of "natural gas," is trapped within the permafrost. As the permafrost melts, it releases this methane, which may seep up through the sediments and into the overlying ocean water.

The deeper sediments of the Beaufort Sea also contain abundant layers of methane hydrate—an ice-like mixture of water and natural gas. As the seafloor has warmed, these hydrates have also begun to decompose, releasing additional methane gas into the surrounding sediment.

These maps show the area to be studied during the
current expedition. The lower map shows the continental
shelf and continental slope of the Beaufort Sea. The
upper image shows detailed seafloor bathymetry of a
portion of the continental slope that will be studied
during the current cruise, as well as the three seafloor
mounds that the researchers will explore using their
new ROV. Lower image modified from Google Maps.
Upper image: Natural Resources Canada.
A tantalizing glimpse

A 2010 expedition by Paull and his colleagues provided a tantalizing glimpse of how much methane is present on the continental shelf of the Beaufort Sea. Using a remotely operated vehicle (ROV) with video camera to explore the shelf edge, they found white mats of methane-loving bacteria almost everywhere. They also videotaped what turned out to be methane bubbles emerging from many of these mats. Based on these observations, as well as the contents of sediment cores collected by the Geological Survey of Canada, the researchers concluded that the shelf edge is an area of "widespread diffuse venting" and that "methane permeates the shelf edge sediments in this region."

During 2010, the research team also conducted ROV dives on a shallow underwater mound called Kopanoar PLF. At the top of this mound they discovered "vigorous and continuous gas venting" that released clouds of bubbles and sediment into the water. In one ROV dive, the researchers saw something no one had ever seen before—a plume of gas bubbles that moved rapidly along the sea floor, apparently following a crack in the sediment that was in the process of being forced open by the pressure of the gas coming up from below.

The researchers also studied several deeper PLFs during the 2010 expedition. They dropped core tubes into the tops of these mounds. When the cores were lifted back onto the ship, the sediments inside fizzed and bubbled for up to an hour. The sediment was chock full of methane hydrates. Paull said, "We knew that there was a lot of gas venting going on down there, and now we have good reasons to believe that methane hydrates are present within the surface sediments. But our ROV couldn't dive deep enough, so we weren't able to go down and see what these areas actually looked like." That's one reason the team is heading back to the Arctic in 2012.

MBARI researchers tested this new mini-ROV
in the institute's test tank before sending it out
to face the challenges of the Arctic Ocean.
Image: Todd Walsh © 2012 MBARI
Heading back for more

For the 2012 expedition, the team will continue its strategy of following the topography to study areas of gas venting in the Beaufort Sea. They plan to focus on three circular, flat-topped mounds on the continental slope. The researchers believe that these pingo-like features form at the tops of "chimneys" or conduits where methane is seeping up from sediments hundreds of meters below the seafloor.

During his previous cruises, Paull used a small ROV that could dive only about 120 meters below the surface. However, the mounds on the continental slope are in about 300 to 800 meters of water. So MBARI engineers Dale Graves and Alana Sherman designed and built an entirely new ROV just for this expedition. The new ROV is small, portable, agile, relatively inexpensive, and can dive to 1,000 meters. It can also be launched and operated by just two people (for the 2012 expedition, those two people will be Graves and Sherman).

Amazingly, the new mini-ROV went from initial design to final field tests in only 15 months. But the vehicle's simple yet elegant design reflects Graves' decades of experience designing ROVs and underwater control systems. "It was a fun project for me," Graves said. "A dream come true. We designed it from scratch with a budget of just $75,000, not including labor. We mostly reused parts from MBARI's older ROVs, and built the rest in house. MBARI's electrical and mechanical technicians and machinists worked on it in between their other projects."

In addition to a state-of-the-art high-definition video camera, the ROV carries a special system for collecting methane gas bubbles. This is not as easy as it sounds, because the methane gas has a tendency to turn back into solid methane hydrate, which blocks the flow of any additional methane gas into the system. The new ROV's gas collection system includes a built-in heater to melt the hydrates and keep the gas flowing.

In addition to collecting samples of gas, the ROV will be used to look for communities of tubeworms or clams that typically grow around seafloor methane seeps. Paull said, "Nobody has ever found a living chemosynthetic biological community in the Arctic proper. But I think we have a good chance of finding them at the tops of these structures."

Dale Graves tests the control system for MBARI's new
mini-ROV in the lab before the Arctic expedition.
The entire system fits in just three small shipping cartons.
Image: Todd Walsh © 2012 MBARI
Addressing the big questions

Although the researchers have begun to understand where the gas in the Beaufort Sea is coming from, many other questions remain. One of the big questions the researchers are trying to answer is whether the three gas chimney structures on the continental slope are related to the gas venting systems in shallower water, on the continental shelf. As Paull put it, "Are they independent gas-venting structures that just happen to be together, or are they all part of the same system?"

Another important question is how all this methane gas affects the stability of the seafloor. When methane hydrates warm up and release methane gas, the gas takes up much more space than the solid hydrate, putting pressure on the surrounding sediments. Similarly, the decomposition of either methane hydrate or permafrost can reduce the mechanical strength of the surrounding sediment. Either process could make the seafloor more susceptible to submarine landslides.

Undersea landslides are common along the continental slope of the Beaufort Sea, but researchers do not yet know when or how they form. However, decomposing methane hydrates are believed to have triggered major landslides in other deep-sea areas. Such landslides could potentially destabilize oil platforms, pipelines, or other equipment on the seafloor, and have the potential to generate tsunamis.

If there is time during the 2012 cruise, the researchers hope to perform ROV dives on one or more underwater-landslides. In Fall 2013, when the team returns to the Beaufort Sea for a fourth time, these features will become the primary focus. During that expedition, the team also hopes to use one of MBARI's autonomous underwater vehicles (AUVs) to make very detailed maps of the shelf edge, the underwater landslides, and areas where methane is bubbling out of the seafloor.

Oil and gas companies have known for decades that deep oil and natural gas deposits exist in the sediments below the continental slope of the Beaufort Sea. With the warming of the Arctic and the retreat of sea ice, these hydrocarbons have become more accessible. However, it remains to be seen whether they can be extracted safely, economically, and without excessive environmental damage. Thus, the team's research will not only provide new insights into previously unknown geological processes, but will also provide important information for decision-makers involved in oil and gas permitting.

For more information on this article, please contact MBARI.

Related links:

Thursday, September 8, 2022

Blue Ocean Event 2022?

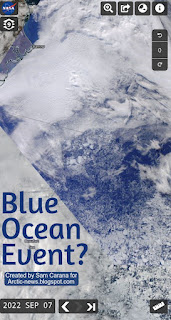
The image on the right shows a NASA Worldview satellite image of a blue Beaufort Sea (with Barrow, Alaska, at the top left, on September 7, 2022). 

The image shows that there is a lot of open water between the coast of Alaska and the sea ice.

Such a satellite image provides a visual way to determine how much sea ice is present. It can be hard to determine where there is open water and where the sea ice starts; the sea ice is often covered by clouds; furthermore, even when there are no clouds, the question remains what is to be regarded as sea ice and what is to be regarded as water. 

Another way to measure how much sea ice is there is to look at sea ice concentration. Sea ice concentration in the Central Arctic region has been very low for some time. 

The image on the right, from an earlier post, shows that on August 12, 2022, sea ice concentration in a large area close to the North Pole was as low as 0%. 

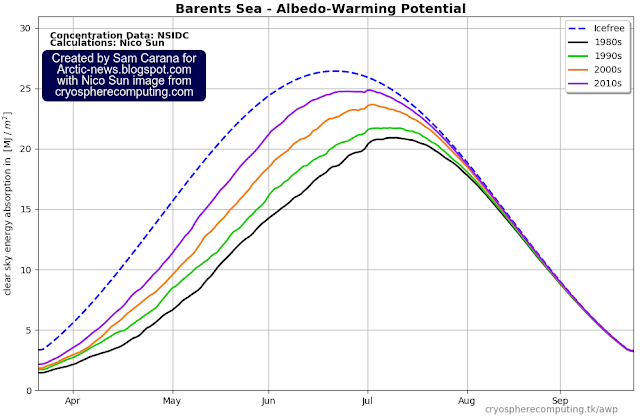
In the two images below, Nico Sun calculates the impact of albedo loss based on NSIDC sea ice concentration data. The images illustrate why sea ice loss in the Central Arctic region is so important.

The image below shows that further albedo loss in the Barents Sea, which is virtually icefree at the moment, doesn't make much difference now. 


The image below shows that, by contrast, more albedo loss in the Central Arctic region makes much more difference, even in September. 


Arctic sea ice has become extremely thin, so the latent heat buffer loss is also very strong. This loss of the latent heat buffer can continue to result in higher temperatures of the water for a long time, even long after insolation has passed its annual peak on the Northern Hemisphere, thus causing the combined accumulative impact to continue to be high.

Another way to measure how much sea ice is present is to look at the extent of the sea ice. According to many, a Blue Ocean Event starts once the Arctic sea ice falls below 1 million km² in extent.

Arctic sea ice extent was 4.912 million km² on September 6, 2022, which is larger than the extent in many previous years around this time of year (see NSIDC image below). However, the sea ice has become very thin, resulting in many areas where only small pieces of ice are present. 


NSIDC regard a cell to have sea ice if it has at least 15% sea ice, but when regarding a cell to have sea ice if it has at least 50% ice and if that's the case for ⅕ of the cells where there is (some) ice, then we're already in a Blue Ocean Event right now.

So let's have another look at how much of the above 4.912 million km² can be regarded as sea ice, by using the NSIDC map with sea ice concentration as a guide. 

The roughly-sketched outline drawn over the NASA map below indicates that there may only have been some 991 thousand km² of concentrated sea ice left on September 6, 2022 (inset shows NSIDC sea ice concentration for the day). 


As said, it's a rough sketch, so some cells with a higher concentration of sea ice may have been left out. Having said that, we're currently in the depth of a persistent La Niña and the associated lower air temperatures contribute to a relatively larger sea ice extent than would otherwise be the case. 

In conclusion, depending on what is counted as sea ice, we could already be experiencing a Blue Ocean Event right now. 

Further events and developments

A Blue Ocean Event constitutes the crossing of a huge tipping point and, as a strong El Niño looks set to emerge, this could trigger the unfolding of further events and developments leading to extinction of most species (including humans), as: 
  1. a strong El Niño triggers: 
  2. further decline of the Arctic sea ice, with loss of the latent heat buffer, combined with
  3. associated loss of sea ice albedo and
  4. destabilization of seafloor methane hydrates, causing eruption of vast amounts of methane that further speed up Arctic warming and cause
  5. rapid thawing of terrestrial permafrost, resulting in even more emissions,
  6. while the Jet Stream gets even more deformed, resulting in more extreme weather events
  7. causing forest fires, at first in Siberia and Canada and
  8. eventually also in the peat fields and tropical rain forests of the Amazon, in Africa and South-east Asia, resulting in
  9. decline of snow and ice on mountains, at first causing huge flooding, followed by 
  10. drought, heatwaves and urban collapse,
  11. collapse of the Greenland and West-Antarctic ice sheets,
  12. falling away of aerosol masking as civilization grinds to a halt, 
  13. further heating due to gases and particulates from wood and waste burning and biomass decomposition, and 
  14. further heating due to additional gases (including water vapor), cirrus clouds, albedo changes and heat rising up from oceans. 


Importantly, depicted above is only one scenario out of many. Things may eventuate in different order and occur simultaneously, i.e. instead of one domino tipping over the next one sequentially, many events may occur simultaneously and reinforce each other. Further events and developments could be added to the list, such as ocean stratification and stronger storms that can push large amounts of warm salty water into the Arctic Ocean.


Here is another example of such a scenario. Recent studies indicate that human-caused climate change will soon increase El Niño frequency and intensity. Accordingly, the upcoming El Niño may well be strong. As illustrated with above image, we're currently in the depth of a persistent La Niña, which suppresses the temperature rise, whereas the opposite occurs during El Niño, which amplifies the temperature rise, and this especially affects the Arctic, which is already heating up much faster than the rest of the world. Also, the upcoming El Niño may very well coincide with a peak in sunspots in 2025, further pushing up temperatures.

The image below shows that the rise in sea surface temperatures on the Northern Hemisphere has been suppressed during the ongoing La Niña, but as we move into the next El Niño, the seafloor methane tipping point could be crossed even earlier than the current trend indicates, say by 2025. 


One reason for this is that the narrowing temperature difference between the Arctic and the Tropics will further deform the Jet Stream and in turn cause more extreme weather, leading to more loss of sea ice and thus of its capacity to reflect sunlight and act as a buffer against incoming ocean heat.

A huge amount of heat has built up in the North Atlantic off the coast of North America, as illustrated by the image on the right.

Furthermore, the temperature of the water may well be substantially higher some 50 meter below the sea surface than at the sea surface. 

As discussed in an earlier post, rising temperatures result in stronger winds along the path of the Gulf Stream that can make huge amounts of warm, salty water travel from the Atlantic Ocean toward the Arctic and reach shallow parts of the Arctic Ocean such as the East Siberian Arctic Shelf (ESAS), where most of the sea is less than 50 m deep. The danger is illustrated by the Argo float compilation below.


Very high methane levels

The image below, from an earlier post, shows annual global mean methane with a trend added that points at a methane rise that could in 2028 represent a forcing of 780 ppm CO₂e (with a 1-year GWP of 200). 

In other words, the clouds tipping point at 1200 ppm CO₂e could be crossed in 2028 due to the forcing of methane and CO₂ alone, assuming that CO₂ concentration in 2028 will exceed 420 ppm. Moreover, this could happen even earlier, since there are further forcers, while further events and developments could additionally push up the temperature further, as discussed above. Furthermore, the NOAA data used in the above image are for marine surface measurements. More methane tends to accumulate at higher altitudes, as illustrated by the compilation image below. 


NOAA's globally averaged marine surface mean for April 2022 was 1909.9 ppb. The above image shows that, on September 4, 2022 am, the MetOp satellite recorded a mean methane concentration of 1904 ppb at 586 mb, which is close to sea level. At 293 mb, however, the MetOp satellite recorded a mean of 1977 ppb, while at 218 mb it recorded a peak of 2805 ppb. 

Such high methane levels could be caused by destabilization of methane hydrates at the seafloor of the Arctic Ocean, with large amounts of methane erupting (increasing 160 x in volume) and rising up at accelerating speed through the water column (since methane is lighter than water), concentrated in the form of plumes, which makes that less methane gets broken down in the water by microbes and in the air by hydroxyl, of which there is very little in the Arctic in the first place. Such a methane eruption entering the atmosphere in the form of a plume can be hard to detect as long as it still doesn't cover enough of the 12 km in diameter footprint to give a pixel the color associated with high methane levels. 


The above Copernicus image shows a forecast  for September 9, 2022 18 UTC, of methane at 500 hPa. 

In the video below, from this page, Guy McPherson addresses the question: Has the “Methane Bomb” Been Triggered?


Conclusion

The situation is dire and the right thing to do now is to help avoid or delay the worst from happening, through action as described in the Climate Plan


Links

• NSIDC - Frequently asked questions

• NASA Worldview

• NSIDC - sea ice concentration

• Nico Sun - CryosphereComputing

• NSIDC - sea ice extent

• More Frequent El Niño Events Predicted by 2040
Cutting-edge models predict that El Niño frequency will increase within 2 decades because of climate change, regardless of emissions mitigation efforts.

• Emergence of climate change in the tropical Pacific - by Yun Ying et al. 
https://www.nature.com/articles/s41558-022-01301-z

• Climate Reanalyzer

• Argo Float

• Monitoring of atmospheric composition using the thermal infrared IASI/MetOp sounder - by C. Clerbaux et al. 

• NOAA - MetOp satellite methane data 

• Copernicus methane forecasts

• Clouds feedback and tipping point

• NOAA - global methane

• NOAA - Sea surface temperature anomalies on the Northern Hemisphere 

• NOAA - Monthly Temperature Anomalies Versus El Niño

• NOAA - ENSO: Recent Evolution, Current Status and Predictions
https://www.cpc.ncep.noaa.gov/products/analysis_monitoring/lanina/enso_evolution-status-fcsts-web.pdf

• WMO predicts first “triple-dip” La Niña of the century


Tuesday, October 13, 2020

High Temperatures October 2020


September 2020 was the warmest September in the NASA record that goes back to 1880. In the image, September 2020 temperatures are compared to 1951-1980.

Global warming is accelerating

Similarly, Copernicus reports that September 2020 global surface air temperature was the highest September temperature on record. The image below shows temperatures averaged over the twelve-month period from October 2019 to September 2020.

Keep in mind that anomalies in the NASA image are compared to 1951-1980, while in the Copernicus image, anomalies are compared to the 1981-2010 average. Anomalies are even higher when compared to pre-industrial levels, as discussed further below.

The Copernicus image shows that the shape of the global anomaly over the past twelve months is very similar to the peak reached around 2016. This confirms that global warming is accelerating, because the peak around 2016 was reached under El Niño conditions, whereas current temperatures are reached under La Niña conditions and while sunspots are at a low, both of which are suppressing temperatures, as discussed in a recent post

What causes this acceleration of the temperature rise?

James Hansen and Makiko Sato confirm that global warming is accelerating and they explore whether this acceleration could be caused by fast feedbacks and short-term natural variability such as the sunspot solar cycle, which they give an amplitude of some 0.25 W/m². James Hansen and Makiko Sato conclude that global warming is accelerating due to a less negative atmospheric aerosol forcing.

Indeed, sunspots cannot explain this acceleration, because we're currently in a sunspot low. 


El Niño/La Niña cannot explain this acceleration either, because we're currently experiencing La Niña conditions, as also illustrated by above NOAA image

Further causes could be explored. As the image below shows, more than 90% of global warming currently goes into oceans. 

[ see also earlier post ]

The two images below shows that high sea surface temperature anomalies feature on the Northern Hemisphere on October 22, 2020, with anomalies (from 1981-2011) as high as 10.2°C or 18.3°F (off the coast of North America). This is the more remarkable since, at the same time, low sea surface temperatures show up over the mid-Pacific, associated with La Niña (image right). 


Stratification may cause oceans to take up less heat and the more heat will remain in the troposphere, the faster the temperature of the troposphere will rise, as discussed in an earlier post

As discussed under feedback #25 at the feedbacks page, the atmosphere can be expected to carry more water vapor as temperatures rise. Since water vapor is a potent greenhouse gas, more water vapor in the atmosphere will contribute to global warming. 

More evaporation also brings more heat into the atmosphere, as illustrated by the image on the right, and more heat will also be transferred to the atmosphere as the area of open water increases in the Arctic Ocean.

Further acceleration of the temperature rise

[ from earlier post ]
Further acceleration of global warming looks set to occur over the next few years as sunspot activity increases and as El Niño conditions will return. 

In 2019, Tiar Dani et al. analyzed a number of studies and forecasts pointing at the maximum in the upcoming Solar Cycle occurring in the year 2023 or 2024.

This analysis, discussed in a recent post, found some variation in intensity between forecasts, adding images including the one on the right, which is based on linear regression and suggests that the Solar Cycle 25 may be higher than the previous Solar Cycle 24. 

The need to rapidly transition to clean, renewable energy 

The international treaty banning nuclear weapons has now been ratified by 50 countries and the treaty will come into force on 22 January 2021, making it illegal to stockpile, produce and use nuclear weapons from January 22, 2021.

The treaty complements the Paris Agreement, the Montreal Protocol and further international agreements that politicians should abide by.

Clean, renewable energy - key to world peace

In the year 1900, there were more electric cars on U.S. roads than gasoline cars. Solar panels were used on a satellite, launched by the US back in 1958. William Thomson proposed using heat pumps for space heating in 1852. The first electricity-generating wind turbine was invented in 1888 in Cleveland, Ohio by Charles Brush.

What has been holding up the innovation in clean, renewable energy technologies such as batteries, solar panels, wind turbines and heat pumps? What stood in the way was the disastrous turn that history took into fossil fuel and nuclear power. Historically, fossil fuel has been a source of conflict that blocked the road to progress. The key to progress and world peace is a rapid transition to clean, renewable energy.

Fossil fuel and control over its supply is behind much of the conflict and violence, as well as pollution that has infested the world for more than a century. Instead of continuing to use fossil fuel, the world must rapidly transition to the use wind turbines, geothermal power, solar power, wave power, and similar ways to generate clean, renewable energy, in combination with hydrogen and batteries and other ways to store energy.

Abundance of local clean, renewable energy

This transition to clean, renewable energy will remove much cause for conflict. Clean, renewable energy is available in abundance LOCALLY around the world (unlike fossil fuel) and the use of clean, renewable energy in one place doesn't exclude use of clean, renewable energy elsewhere.

Clean, renewable energy's numerous benefits

This transition also comes with greater energy security and reliability, next to its numerous further benefits, e.g. it will make more land and water available for growing food and it will generate better and more jobs and investment opportunities, and improve our health, in addition to the reductions in greenhouse gases that come with this transition.

Clean, renewable energy is also cheaper

Importantly, it is also more economic to use clean, renewable energy, so the transition will more than pay for itself as we go. The more prices of solar panels, batteries, heat pumps, etc. keep falling, and the more urgency there is to act on climate change, the more sense it makes to transition to clean, renewable energy as soon as possible. Innovation has resulted in a huge drop in the cost of generating and storing clean, renewable electricity. In the Lazard 2019 analysis of the cost of energy and storage, the unsubsidized cost of solar PV (thin film utility scale) was $US32-42/MWh, i.e. already lower than the cost of fossil fuel and nuclear, which ranged from $US44-199/MWh (see image). A recent tender for solar panels in Portugal received an offer equivalent to a price of $US13/MWh. 

Aerosols
 
Yet, while the transition to clean, renewable energy makes sense from so many perspectives, while it is absolutely necessary, and while it will reduce temperatures, this transition will not immediately result in lower overall temperatures, for a number of reasons. Maximum warming occurs about one decade after a carbon dioxide emission, so the full warming wrath of the carbon dioxide emissions over the past ten years is still to come, as discussed at the extinction page. Even with dramatic cuts in emissions, temperatures will not fall as long as levels of greenhouse gases in the atmosphere remain high. Additionally, sulfate cooling loss will further increase temperatures, as the world progresses with the necessary transition to the use of clean, renewable electricity. So, additional action is needed! 

A rapid, steep temperature rise

The danger is that a rapid and steep temperature rise will be triggered by a combination of elements such as El Niño, sunspots, oceans taking up less heat and changes to aerosols such as further sulfate cooling loss. 

The potential for such a rapid, steep temperature rise is also illustrated by the image below, posted in February 2019 and showing a potential total rise of 18°C or 32.4°F from 1750 by the year 2026.

[ from earlier post ]

A rapid, steep temperature rise would be felt most strongly in the Arctic, causing albedo loss, emissions and transfer of heat from ocean to atmosphere that would all hit the Arctic most strongly, thus further speeding up the temperature rise, as also illustrated by the image below. 


As discussed in an earlier post, a rise of more than 5°C could happen within a decade, possible by 2026. Humans will likely go extinct with a 3°C rise and most life on Earth will disappear with a 5°C rise. 

[ from earlier post ]

Arctic Sea Ice

Meanwhile, temperatures in the Arctic have been very high, as illustrated by the image below showing air temperature in the Arctic up to October 12, 2020 (red line). 


For some time, Arctic sea ice exent has been at a record low for the time of year, as illustrated by the image below, showing the situation on October 20, 2020. 


For some time, sea ice area has also been at a record low for the time of year, as illustrated by the image below, showing the situation up to October 22, 2020.


Arctic sea ice volume has been very low, as illustrated by the image below showing volume up to September 30, 2020. 


As the image below shows, there was a lot of open water north of Greenland on October 23, 2020.


The image below, showing land outlines, is added for reference purposes. See also further images at this facebook post.


Temperature anomalies over the Arctic Ocean remain high. The image below shows a forecast for November 8, 2020 12Z. Very high temperature anomalies are visible over the Arctic Ocean, in particular over the East Siberian Arctic Shelf, while the Arctic as a whole shows an anomaly of 6.1°C compared to 1979-2000.


These high temperature anomalies reflect overheating of the Arctic Ocean with the sea ice no longer acting as a buffer to consume heat.

Furthermore, these high temperatures in October and November 2020 reduce the chances that sea ice will build up much thickness over the next few months, meaning there will be little or no buffer to consume incoming heat as temperatures start to rise again early next year. 

Without such a buffer, and with greater odds of high temperatures at the start of the melting season, the threat increases of destabilization of methane hydrates contained in sediments at the seafloor of the Arctic Ocean. 

Meanwhile, the temperature of the ocean on the Northern Hemisphere keeps increasing, as illustrated by the image below, from an earlier post


As the Arctic warms up faster than the rest of the world, the temperature difference between the North Pole and the Equator narrows, making the jet stream wavier, thus enabling warm air over the Pacific Arctic to move more easily into the Arctic, as discussed in many earlier posts such as this one, which featured a forecast for March 31, 2019, with a temperature anomaly for the Arctic of 7.7°C or 13.86°F and local anomalies approaching 30°C or 54°F higher than 1979-2000.

So, the odds are increasing that very high temperatures will hit the Arctic at the start of the melting season, further increasing the threat of destabilization of methane hydrates contained in sediments at the seafloor of the Arctic Ocean. 

The Methane Threat

On October 26, 2020 pm, the NetOp-1 satellite recorded methane levels as high as 2537 ppb. 

Where did such high levels originate? The animation shows areas solidly magenta-colored and indicating high methane levels to first appear over the East Siberian Arctic Shelf close to sea level, and to grow larger and cover more of the Arctic Ocean at higher altitudes. 

As discussed repeatedly in earlier posts such as this one and as illustrated by the image below, from a recent post, methane levels are rising most strongly at higher altitudes. 

[ from earlier post ]

As discussed in a 2017 post, methane eruptions from the Arctic Ocean can be missed by measuring stations that are located on land and that often take measurements at low altitude, thus missing the methane that rises in plumes from the Arctic Ocean. Since seafloor methane is rising in plumes, it hardly shows up on satellite images at lower altitude either, as the methane is very concentrated inside the area of the plume, while little or no increase in methane levels is taking place outside the plume. Since the plume will cover less than half the area of one pixel, such a plume doesn't show up well at low altitudes on satellite images.

Over the poles, the Troposphere doesn't reach the heights it does over the tropics. At higher altitudes, methane will follow the Tropopause, i.e. the methane will rise in altitude while moving closer to the Equator.

Methane rises from the Arctic Ocean concentrated in plumes, pushing away the aerosols and gases that slow down the rise of methane elsewhere, which enables methane erupting from the Arctic Ocean to rise straight up fast and reach the stratosphere. Since little hydroxyl is present in the atmosphere over the Arctic, it is much harder for this methane to be broken down. 

What further makes the rise of methane at these high altitudes very worrying is that once methane does reach the stratosphere, it can remain there for a long time. The IPCC in 2013 (AR5) gave methane a lifetime of 12.4 years. The IPCC in 2001 (TAR) gave stratospheric methane a lifetime of 120 years, adding that less than 7% of methane did reach the stratosphere.

Conclusion

The situation is dire and calls for immediate, comprehensive and effective action, as described in the Climate Plan.


Links

• Copernicus - Surface air temperature for September 2020
https://climate.copernicus.eu/surface-air-temperature-september-2020

• NASA - Temperature anomalies September 2020
https://data.giss.nasa.gov/gistemp/maps/index.html

• September 2020 Global Temperature Update - by James Hansen
http://www.columbia.edu/~mhs119/Temperature/Emails/September2020.pdf

• Accelerated Global Warming (14 October 2020) - by James Hansen and Makiko Sato
http://www.columbia.edu/~jeh1/mailings/2020/20201014_AcceleratedWarming.pdf

• NOAA - Global monthly temperature anomalies, with ENSO status
https://www.ncdc.noaa.gov/sotc/global/202009/supplemental/page-4

• ENSO: Recent Evolution, Current Status and Predictions - NOAA, October 12, 2020
https://www.cpc.ncep.noaa.gov/products/analysis_monitoring/lanina/enso_evolution-status-fcsts-web.pdf

• Danish Meteorological Institute - Arctic temperature
http://ocean.dmi.dk/arctic/meant80n.uk.php

• Climate reanalyzer
https://climatereanalyzer.org

• Cryospherecomputing - by Nico Sun 
http://cryospherecomputing.tk

• Arctic sea ice extent - Vishop, Arctic Data archive System, National Institute of Polar Research, Japan 
https://ads.nipr.ac.jp/vishop/#/extent

• Portugal’s second solar PV tender sets new world record low price

• Lazard 2019 analysis of the cost of energy and storage 
https://www.lazard.com/perspective/lcoe2019

• UN Secretary-General's Spokesman - on the occasion of the 50th ratification of the Treaty on the Prohibition of Nuclear Weapons 
https://www.un.org/sg/en/content/sg/statement/2020-10-24/un-secretary-generals-spokesman-the-occasion-of-the-50th-ratification-of-the-treaty-the-prohibition-of-nuclear-weapons

• Temperatures threaten to become unbearable
https://arctic-news.blogspot.com/2020/09/temperatures-threaten-to-become-unbearable.html 

• Methane Hydrates Tipping Point threatens to get crossed
https://arctic-news.blogspot.com/2017/04/10c-or-18f-warmer-by-2021.html

• A Global Temperature Rise Of More than Ten Degrees Celsius By 2026?

Sunday, April 29, 2012

Supplementary evidence by Prof. Peter Wadhams

Supplementary written evidence 
submitted by Professor Peter Wadhams 
to the Environmental Audit Committee (EAC)
I am writing in response to information provided recently by Professor Julia Slingo OBE, Chief Scientist, Meteorological Office, firstly in the report 'Possibility and Impact of Rapid Climate Change in the Arctic' to the Environmental Audit Committee and subsequently in answering questions from the Committee on Wednesday 14 March 2012. In the responses, the Meteorological Office refers to an earlier presentation to the Committee by myself, made on 21 February 2012.
The following comments are based on the uncorrected transcript of Professor Slingo’s presentation to the EAC, 14 March 2012 session, as at: 
http://www.publications.parliament.uk/pa/cm201012/cmselect/cmenvaud/uc1739-iv/uc173901.htm
1. Speed of ice loss
In response to questions from the Chair, Prof. Slingo ruled out an ice-free summer by as early as 2015. Furthermore, Prof. Slingo rejected data which shows a decline in Arctic sea ice volume of 75% and also rejected the possibility that further decreases may cause an immediate collapse of ice cover.
The data that Prof. Slingo rejected are part of PIOMAS, which is held in high regard, not only by me, but also by many experts in the field. From my position of somebody who has studied the Arctic for many years and has been actively participating in submarine measurements of the Arctic ice thickness since 1976, it seems extraordinary to me that for Prof. Slingo can effectively rule out these PIOMAS data in her consideration of the evidence for decreasing ice volume, when one considers the vast effort and diligence that has been invested over such an extended period in collecting data under the ice by both British and US scientists. Prof. Slingo offers no reason whatsoever for dismissing this extremely pertinent set of measurements and their associated interpretation, arguing that "the observational estimates are still very uncertain". This is not the case. I expand on this in an Appendix to my letter.
It has to be said that it is very poor scientific practice to reject in such a cavalier fashion any source of data that has been gathered according to accepted high scientific standards and published in numerous papers in high-profile journals such as Nature and Journal of Geophysical Research, the more so when the sole reason for this rejection appears to be perceived uncertainty. If other data are in conflict with one’s own data, then caution should be given to the validity of one’s own data, while this should immediately set in train further research and measurement in efforts to resolve possible conflicts. In this case, however, the crucial point is that there is currently no rival set of data to compare with the scale and comprehensiveness of the PIOMAS data; Prof. Slingo sets against the clear observational database only the Met. Office’s models. These models (and in fact all the models used by IPCC) have already shown themselves to be inadequate in that they failed to predict the rapid decline in sea ice area which has occurred in recent years. It is absurd in such a case to prefer the predictions of failed models to an obvious near-term extrapolation based on observed and measured trends.
Regarding the possibility of an imminent collapse of sea ice, Prof. Slingo ignores a point raised earlier by herself, i.e. that, apart from melting, strong winds can also influence sea ice extent, as happened in 2007 when much ice was driven across the Arctic Ocean by southerly winds (not northerly, as she stated). The fact that this occurred can only lead us to conclude that this could happen again. Natural variability offers no reason to rule out such a collapse, since natural variability works both ways, it could bring about such a collapse either earlier or later than models indicate.
In fact, the thinner the sea ice gets, the more likely an early collapse is to occur. It is accepted science that global warming will increase the intensity of extreme weather events, so more heavy winds and more intense storms can be expected to increasingly break up the remaining ice, both mechanically and by enhancing ocean heat transfer to the under-ice surface.
The concluding observation I have to make on this first point is that Prof. Slingo has not provided any justification for ignoring the measurements that we have of ice volume changes and the clear trend towards imminent ice-free summers that they indicate.
2. Methane – potential emissions and escalation
My second point of contention is Prof. Slingo’s position on the possibility of imminent large releases of methane in the Arctic, which is consistent with her sanguine attitude to the rate of loss of ice cover. She states "Our estimates of those (large releases of methane) are that we are not looking at catastrophic releases of methane." Prof Slingo suggests that there was "a lack of clarity in thinking about how that heating at the upper level of the ocean can get down, and how rapidly it can get down into the deeper layers of the ocean". This appears to show a lack of understanding of the well-known process of ocean mixing. As Prof. Slingo earlier brought up herself, strong winds can cause mixing of the vertical water column, bringing heat down to the seabed, especially so in the shallow waters of the East Siberian Arctic Shelf. A recent paper shows that "data obtained in the ESAS during the drilling expedition of 2011 showed no frozen sediments at all within the 53 m long drilling core" (Dr. Natalia Shakhova et al. in: EGU General Assembly 2012;
http://meetingorganizer.copernicus.org/EGU2012/EGU2012-3877-1.pdf ).
The East Siberian Arctic Shelf (ESAS), where the intensive seabed methane emissions have been recorded, is only about 50 m deep. Throughout the world ocean, the Mixed Layer (the near-surface layer where wind-induced mixing of water occurs) is typically 100-200 m deep. It is shallower only in areas where the water is extremely calm. This used to be the case for the Arctic Ocean because of its ice cover, but it is no longer the case, because of the large-scale summer sea ice retreat which has created a wide-open Beaufort Sea where storms can create waves as high as in any other ocean, which exert their full mixing effect on the waters. It is certain that a 50 m deep open shelf sea is mixed to the bottom, so I am at a loss to understand Prof. Slingo’s remarks, unless she is thinking of the deep ocean or deeper shelves elsewhere than the East Siberian Sea.
Furthermore, Prof. Slingo states that "where there is methane coming out of the continental shelf there it is not reaching the surface either, because again the methane is oxidised during its passage through the sea water and none of those plumes made it to the surface. So there is a general consensus that only a small fraction of methane, when it is released through this gradual process of warming of the continental shelf, actually reaches the surface." This statement is also incomprehensible as far as the East Siberian Arctic Shelf is concerned. With such a shallow water depth the methane plume reaches the surface within a few seconds of release, giving little opportunity for oxidation on the way up. She may be confusing this situation with that of the much deeper waters off Svalbard where methane plumes are indeed observed to peter out before reaching the surface, due to oxidation within the water column.
To illustrate the reality of this warming of ESAS shelf water, I reproduce (fig. 1) a satellite sea surface temperature data (SST) map from September 2011, provided by Dr James Overland of Pacific Marine Environmental Laboratory (PMEL), Seattle. This shows that in summer 2011 the surface water temperature in the open part of the Beaufort and Chukchi seas reached a massive 6-7°C over most of the region and up to 9°C along the Arctic coast of Alaska. This is warmer than the temperature of the North Sea at Scarborough yesterday. This extraordinary warming is due to absorption of solar radiation by the open water. These are not the temperatures of a very thin skin as suggested by Prof. Slingo. The NOAA data apply to the uppermost 7 m of the ocean, while PMEL has backup data from Wave Gliders (automatic vehicles that run oceanographic surveys at preprogrammed depths) to show that this warming extends to at least 20 m. We can conclude from fig.1 that an extraordinary seabed warming is taking place, certainly sufficient to cause rapid melt of offshore permafrost, and this must cause serious concern with respect to the danger of a large methane outbreak.
Once the methane reaches the surface, one should note that there is very little hydroxyl in the Arctic atmosphere to break down the methane, a situation that again becomes even worse with large releases of methane.
3. The choice of pursuing geo-engineering or not.
Finally, I would like to address Prof. Slingo’s closing remarks on geo-engineering.
Both Professor Slingo and Professor Lenton repeat a point made by many critics of geo-engineering that once you start geoengineering you have to continue. On this point, I like to draw attention to evidence earlier provided to the Environmental Audit Committee by Professor Stephen Salter, as can be found at
http://www.publications.parliament.uk/pa/cm201012/cmselect/cmenvaud/writev/1739/arc22.htm
Prof. Salter responds: "I must disagree. You have to continue only until emissions have fallen sufficiently or CO2 removal methods have proved effective or there is a collective world view that abrupt global warming is a good thing after all. No action by the geo-engineering community is impeding these. Indeed everyone working in the field hopes that geoengineering will never be needed but fears that it might be needed with the greatest urgency. This is like the view of people who hope and pray that houses will not catch fire and cars will not crash but still want emergency services to be well trained and well equipped with ambulances and fires engines." Basically he is talking about the precautionary principle.
I fully agree with Prof. Salter on this point, and I also fully share with Prof. Salter the anxieties of the Arctic Methane Emergency Group. A highly proactive geo-engineering research programme aimed at mitigating global warming is more rational than expecting the worst but not taking any action to avert it.
Peter Wadhams,
Professor of Ocean Physics,
Department of Applied Mathematics and Theoretical Physics (DAMTP),
University of Cambridge
Member of Arctic Methane Emergency Group; Review Editor for Intergovernmental Panel on Climate Change 5th Assessment (chapter 1).


FIG.1. September 12-13 2011. NOAA-6 and-7 imagery of sea surface temperature in Beaufort Sea (courtesy of J. Overland). Alaska is brown land mass in bottom half. Note 6-7°C temperatures (green) in west, over East Siberian Shelf, and up to 9°C (orange) along Alaskan coast.
Appendix. The scientific database for sea ice loss.
On a previous occasion (21 February) I testified to the Committee and showed them the results of submarine measurements of ic thickness combined with satellite observations of ice retreat. When these two datasets are combined , they demonstrate beyond doubt that the volume of sea ice in the Arctic has seriously diminished over the past 40 years, by about 75% in the case of the late summer volume. If this decline is extrapolated, then without the need for models (which have demonstrably failed to predict the rapid retreat of sea ice in the last few years) it can be easily seen that the summer sea ice will disappear by about 2016 (plus or minus about 3 years). It might be useful to summarise the history of research in this subject.
In her testimony Prof Slingo placed her faith in model predictions and in future data to come from satellites on thickness (presumably Cryosat-2, which has not yet produced any usable data on ice thickness). Yet since the 1950s US and British submarines have been regularly sailing to the Arctic (I have been doing it since 1976) and accurately measuring ice thickness in transects across that ocean. Her statement that "we do not know the ice thickness in the Arctic" is false. In 1990 I published the first evidence of ice thinning in the Arctic in Nature (Wadhams, 1990). At that stage it was a 15% thinning over the Eurasian Basin. Incorporating later data my group was able to demonstrate a 43% thinning by the late 1990s (Wadhams and Davis, 2000, 2001), and this was in exact agreement with observations made by Dr Drew Rothrock of the University of Washington, who has had the main responsibility for analyzing data from US submarines (Rothrock et al., 1999, 2003; Kwok and Rothrock, 2009) and who examined all the other sectors of the Arctic Ocean. In fact in his 2003 paper Rothrock showed that in every sector of the Arctic Ocean a substantial hickness loss had occurred in the preceding 20 years. Further thinning has since been demonstrated, e.g. see my latest paper on this (Wadhams et al., 2011). Among the foremost US researchers at present active on sea ice volume decline are Dr Ron Kwok of the NASA Jet Propulsion Laboratory and Dr Axel Schweiger of University of Washington (leader of the PIOMAS project), and these have both been moved to write to Prof Slingo expressing their surprise at her remarks deriding the scientific database.
Even if we only consider a 43% loss of mean thickness (which was documented as occurring up to 1999), the accompanying loss of area (30-40%) gives a volume loss of some 75%. Summer melt measurements made in 2007 in the Beaufort Sea by Perovich et al. (2008) showed 2 m of bottom melt. If these enhanced melt rates are applied to ice which is mainly first-year and which has itself suffered thinning through global warming, then it is clear that very soon we will be facing a collapse of the ice cover through summer melt being greater than winter growth. These observations do not just come from me but also from the PIOMAS project at the University of Washington (a programme to map volume change of sea ice led by Dr Rothrock himself and Dr Schweiger), the satellite-based work of Ron Kwok, and the high-resolution modelling work of Dr Wieslaw Maslowsky at the Naval Postgraduate School, Monterey (e.g. Maslowsky et al 2011).
References
Kwok, R., and D. A. Rothrock ( 2009 ), Decline in Arctic sea ice thickness from submarine and ICESat records: 1958- 2008,Geophys. Res. Lett ., 36, L15501.
Maslowsky, W., J. Haynes, R. Osinski, W Shaw (2011). The importance of oceanic forcing on Arctic sea ice melting. European Geophysical Union congress paper XY556. See also Proceedings, State of the Arctic 2010, NSIDC.
Perovich, D.K., J.A. Richter-Menge, K.F. Jones, and B. Light (2008). Sunlight, water, ice: Extreme Arctic sea ice melt during the summer of 2007. Geophysical Research Letters 35: L11501. doi: 10.1029/2008GL034007 .
Rothrock, D.A., Y. Yu, and G.A. Maykut. (1999). Thinning of the Arctic sea-ice cover . Geophysical Research Letters 26: 3469–3472.
Rothrock, D.A., J. Zhang, and Y. Yu. (2003). The arctic ice thickness anomaly of the 1990s: A consistent view from observations and models. Journal of Geophysical Research 108: 3083. doi: 10.1029/2001JC001208 .
Shakhova, N. and I. Semiletov (2012). Methane release from the East-Siberian Arctic Shelf and its connection with permafrost and hydrate destabilization: First results and potential future development. Geophys. Res., Vol. 14, EGU2012-3877-1.
Wadhams, P. (1990). Evidence for thinning of the Arctic ice cover north of Greenland. Nature 345: 795–797.
Wadhams, P., and N.R. Davis. (2000). Further evidence of ice thinning in the Arctic Ocean. Geophysical Research Letters 27: 3973–3975.
Wadhams, P., and N.R. Davis (2001). Arctic sea-ice morphological characteristics in summer 1996. Annals of Glaciology 33: 165–170.
Wadhams, P., N Hughes and J Rodrigues (2011). Arctic sea ice thickness characteristics in winter 2004 and 2007 from submarine sonar transects. J. Geophys. Res., 116, C00E02.