Showing posts with label volume. Show all posts

Tuesday, July 30, 2019

Arctic Sea Ice Gone By September 2019?

Record low Arctic sea ice extent for the time of year


Arctic sea ice minimum extent typically occurs about half September. In 2012, minimum extent was reached on September 17, 2012, when extent was 3.387 million km².

On July 28, 2019, Arctic sea ice extent was 6.576 million km². How much extent do you think there will be by September 17, 2019? From July 28, 2019, to September 17, 2019, that's a period of 52 days during which a lot of melting can occur. Could there be a Blue Ocean Event in 2019, with virtually all sea ice disappearing in the Arctic?

Consider this. Extent was 6.926 million km² on September 17, 1989. Extent was 3.387 million km² on September 17, 2012, so 3.539 million km² had disappeared in 23 years. Over those years, more ice extent disappeared than what was left on September 17, 2012.

The question is how much sea ice extent will be left when it will reach its minimum this year, i.e. in September 2019. The red dashed line on the image at the top continues the path of the recent fall in sea ice extent, pointing at zero Arctic sea ice extent in September 2019. Progress is followed at this post.

Zero Arctic sea ice in 2019

Zero Arctic sea ice in 2019 sounds alarming, and there is good reason to be alarmed.


Above map shows temperatures on Greenland on July 31, 2019, with temperatures at one location as high as 23.2°C or 73.8°F and at another location - in the north - as high as 14.2°C or 57.6°F.

The map on the right shows sea surface temperature anomalies compared to 1961-1990 as on July 29, 2019. Note the high anomalies in the areas where the sea ice did disappear during the past few months. The reason for these high anomalies is that the buffer has disappeared that previously had kept consuming heat in the process of melting.

Where that buffer is gone, the heat has to go somewhere else, so it will be absorbed by the water and it will also speed up heating of the atmosphere over the Arctic.

Sea ice melting is accelerating for a number of reasons:
  • Ocean Heat - Much of the melting of the sea ice occurs from below and is caused by heat arriving in the Arctic Ocean from the Atlantic Ocean and the Pacific Ocean. 
  • Direct Sunlight - Hot air will melt the ice from above and this kind of melting can increase strongly due to changing wind patterns. 
  • Rivers - Heatwaves over land can extend over the Arctic Ocean and they also heat up river water flowing into the Arctic Ocean.
  • Fires - Changing wind patterns can also increase the intensity and duration of such heatwaves that can also come with fires resulting in huge amounts of greenhouse gas emissions, thus further speeding up the temperature rise, and also resulting in huge emissions of soot that, when settling on sea ice, speeds up melting (see images below). 
  • Numerous feedbacks will further speed up melting. Heating is changing the texture of the sea ice at the top and is making melt pools appear, both of which cause darkening of the surface. Some further feedbacks, i.e. storms and clouds are discussed below in more detail. 

Above combination image shows smoke from fires in Siberia getting pushed over the Laptev Sea on August 11, 2019, due to cyclonic winds over the Arctic Ocean. This was also discussed in an earlier post. The image below shows the situation on August 12, 2019.


The image below shows the situation on August 14, 2019.


In the video below, Paul Beckwith discusses the situation.


In the video below, Paul Beckwith discusses the heating impact of albedo loss due to Arctic sea ice loss, including the calculations in a recent paper.


As the Arctic is heating up faster than the rest of the world, it is also more strongly affected by the resulting extreme weather events, such as heatwaves, fires, strong winds, rain and hail storms, and such events can strongly speed up the melting of the sea ice.


All around Greenland, sea ice has now virtually disappeared. This is the more alarming considering that the thickest sea ice was once located north of Greenland. This indicates that the buffer is almost gone.

Why is disappearance of Arctic sea ice so important? Hand in hand with albedo loss as the sea ice disappears, there is loss of the buffer (feedbacks #1, #14 and more). As long as there is sea ice in the water, this sea ice will keep absorbing heat as it melts, so the temperature will not rise at the sea surface. The amount of energy absorbed by melting ice is as much as it takes to heat an equivalent mass of water from zero to 80°C.


Once the sea ice is gone, further heat must go elsewhere. This heat will raise the temperature of the water and will also make the atmosphere heat up faster.

Storms and Clouds

Storms: As temperatures in the Arctic are rising faster than at the Equator, the Jet Stream is changing, making it easier for warm air to enter the Arctic and for cold air to descend over continents that can thus become much colder than the oceans, and this stronger temperature difference fuels storms.

Clouds: More evaporation will occur as the sea ice disappears, thus further heating up the atmosphere (technically know as latent heat of vaporization).

In the video below, Paul Beckwith further discusses Arctic albedo change and clouds.


Disappearance of the sea ice causes more clouds to form over the Arctic. This on the one hand makes that more sunlight gets reflected back into space. On the other hand, this also make that less outward infrared radiation can escape into space. The net effect of more clouds is that they are likely cause further heating of the air over the Arctic Ocean (feedbacks #23 and #25).

More low-altitude clouds will reflect more sunlight back into space, and this occurs most during Summer when there is most sunshine over the Arctic. The image below, a forecast for August 17, 2019, shows rain over the Arctic. Indeed, more clouds in Summer can also mean rain, which can devastate sea ice, as discussed in an earlier post.


Regarding less outward radiation, the IPCC has long warned, e.g. in TAR, about a reduction in outgoing longwave radiation (OLR): "An increase in water vapour reduces the OLR only if it occurs at an altitude where the temperature is lower than the ground temperature, and the impact grows sharply as the temperature difference increases."

While reduction in OLR due to water vapor is occurring all year long, the impact is particularly felt in the Arctic in Winter when the air is much colder than the surface. In other words, less OLR makes Arctic sea ice thinner, especially in Winter.

The inflow of ocean heat into the Arctic Ocean can increase strongly as winds increase in intensity. Storms can push huge amounts of hot, salty water into the Arctic Ocean, as discussed earlier, such as in this post and this post. As also described at the extreme weather page, stronger storms in Winter will push more ocean heat from the Atlantic toward the Arctic Ocean, further contributing to Arctic sea ice thinning in Winter.

Seafloor Methane


[ The Buffer has gone, feedbacks #14 and #16 ]

As the buffer disappears that until now has consumed huge amounts of heat, the temperature of the water of the Arctic Ocean will rise even more rapidly, with the danger that further heat will reach methane hydrates at the seafloor of the Arctic Ocean, causing them to get destabilized and release huge amounts of methane (feedback #16).

Ominously, high methane levels were recorded at Barrow, Alaska, at the end of July 2019, as above image shows.


[ from an earlier post ]
And ominously, a mean global methane level as high as 1902 ppb was recorded by the MetOp-1 satellite in the afternoon of July 31, 2019, as above image shows.

As the image on the right shows, mean global levels of methane (CH₄) have risen much faster than carbon dioxide (CO₂) and nitrous oxide (N₂O), in 2017 reaching, respectively, 257%, 146% and 122% their 1750 levels.

Temperature Rise

Huge releases of seafloor methane alone could make marine stratus clouds disappear, as described in an earlier post, and this clouds feedback could cause a further 8°C global temperature rise.

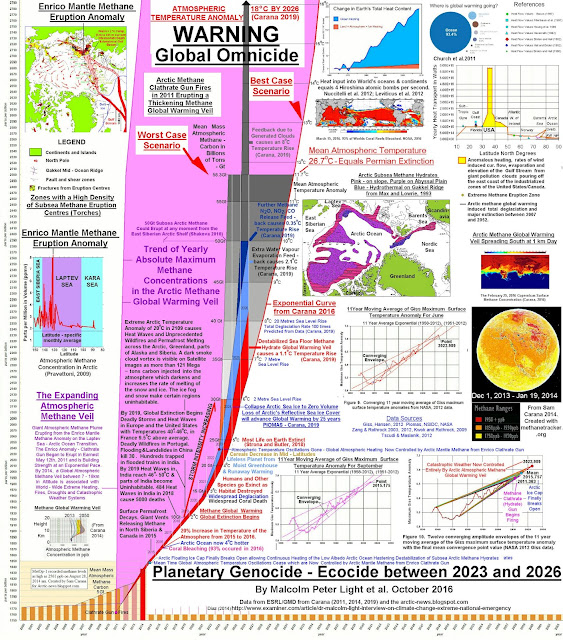
Indeed, a rapid temperature rise of as much as 18°C could result by the year 2026 due to a combination of elements, including albedo changes, loss of sulfate cooling, and methane released from destabilizing hydrates contained in sediments at the seafloor of oceans.

[ from an earlier post ]

Below is Malcolm Light's updated Extinction Diagram.
[ click on images to enlarge ]
The situation is dire and calls for comprehensive and effective action, as described in the Climate Plan.


Link

• Climate Plan
https://arctic-news.blogspot.com/p/climateplan.html

• Smoke Covers Much Of Siberia
https://arctic-news.blogspot.com/2019/07/smoke-covers-much-of-siberia.html

• Extreme Weather
https://arctic-news.blogspot.com/p/extreme-weather.html

• Albedo and more
https://arctic-news.blogspot.com/p/albedo.html

• Radiative Heating of an Ice‐Free Arctic Ocean, by Kristina Pistone et al. (2019)
https://agupubs.onlinelibrary.wiley.com/doi/10.1029/2019GL082914

• High cloud coverage over melted areas dominates the impact of clouds on the albedo feedback in the Arctic, by Min He et al. (2019)
https://www.nature.com/articles/s41598-019-44155-w

• ESD Reviews: Climate feedbacks in the Earth system and prospects for their evaluation, by Christoph Heinze et al. (2019)
https://www.earth-syst-dynam.net/10/379/2019/esd-10-379-2019-discussion.html

• Contribution of sea ice albedo and insulation effects to Arctic amplification in the EC-Earth Pliocene simulation, by Jianqiu Zheng et al. (2019)
https://www.clim-past.net/15/291/2019

• Far-infrared surface emissivity and climate, by Daniel Feldman et al. (2014)
https://www.pnas.org/content/111/46/16297.abstract

• Extreme Weather
https://arctic-news.blogspot.com/p/extreme-weather.html

• Feedbacks in the Arctic
https://arctic-news.blogspot.com/p/feedbacks.html

• Rain Storms Devastate Arctic Ice And Glaciers
https://arctic-news.blogspot.com/2015/01/rain-storms-devastate-arctic-ice-and-glaciers.html

• A rise of 18°C or 32.4°F by 2026?
https://arctic-news.blogspot.com/2019/02/a-rise-of-18c-or-324f-by-2026.html

• As El Niño sets in, will global biodiversity collapse in 2019?
https://arctic-news.blogspot.com/2018/11/as-el-nino-sets-in-will-global-biodiversity-collapse-in-2019.html

• Dangerous situation in Arctic
https://arctic-news.blogspot.com/2018/11/dangerous-situation-in-arctic.html

• Warning of mass extinction of species, including humans, within one decade
https://arctic-news.blogspot.com/2017/02/warning-of-mass-extinction-of-species-including-humans-within-one-decade.html


Thursday, July 25, 2019

Smoke Covers Much Of Siberia

Smoke covers much of Siberia, as shown by the NASA Worldview image dated July 25, 2019.


The enormous intensity of the fires is illustrated by the image below, showing carbon monoxide (CO) levels as high as 80,665 ppb on July 25, 2019.


The image below shows that, at that same spot on July 25, 2019, carbon dioxide (CO₂) levels were as high as 1205 ppm.


The image below shows that aerosols from biomass burning were at the top end of the scale.


When soot from fires settles on snow and ice, it darkens the surface, resulting in more sunlight getting absorbed (instead of reflected back into space, as was previously the case), thus further speeding up the melting.

The loss of sea ice north of Greenland is particularly worrying, since this is the area where once the thickest sea ice was present. The image below shows the situation on July 24, 2019.


The image below shows the sea ice disappearing north of Greenland and Ellesmere Island on July 25, 2019.


The huge recent fall in sea ice volume is illustrated by the graph below, by Wipneus.


The naval.mil animation below illustrates the rapid fall in sea ice thickness, showing 30-day period including seven forecasts up to August 1, 2019.


The combination image below shows sea ice thickness forecasts for July 25, 2019, and for August 1, 2019.


The video below, by Robin Westenra, further illustrates our predicament.


The situation is dire and calls for comprehensive and effective action, as described in the Climate Plan.


Links


• Climate Plan
https://arctic-news.blogspot.com/p/climateplan.html


Friday, July 13, 2018

Disappearance of Arctic Sea Ice

The image on the right shows sea surface temperatures on July 6 for the years 2014 to 2018 at a location near Svalbard (at 77.958°N, 5.545°E), with an exponential trend added based on the data.

The combination image below shows sea surface temperatures on July 6 for each of these years, with the location highlighted by a green circle:
2014:  -0.8°C or 30.6°F
2015:   6.2°C or 43.2°F
2016:   8.3°C or 47.0°F
2017: 14.4°C or 57.9°F
2018: 16.6°C or 61.9°F

The situation reflects the rapid decline of Arctic sea ice over the years and constitutes a stark warning of imminent sea ice collapse and its consequences for the world at large.

[ click on images to enlarge ]
The image on the right shows the sea surface temperature on July 18, 2018, at that location. It was as warm as 17.2°C or 63°F near Svalbard. This compares to a sea surface temperature of 5°C or 41.1°F in 1981-2011 at that location (at the green circle). For more background on the warm water near Svalbard, also see the earlier post Accelerating Warming of the Arctic Ocean.

The images illustrate why sea ice has fallen dramatically in volume, especially so where sea currents push warm water from the Atlantic Ocean underneath the sea ice.

The decline of Arctic sea ice volume over the years is illustrated by the Jim Pettit graph below.

As the Wipneus image below shows, Arctic sea ice volume on July 9, 2018, was at a record low for the time of the year.


The animation on the right shows a fall in volume of some 1 meter over most of the sea ice, over the period from June 21 through July 12, 2018, with a further eight days of forecasts added.

The animation illustrates the huge amount of melting taking place from underneath, due to an inflow of heat from the Atlantic Ocean and the Pacific Ocean, and from warm water from rivers that end in the Arctic Ocean. Meanwhile, sea ice extent doesn't fall very much at all.

When only looking at sea ice extent, the dramatic fall in sea ice volume may be overlooked.

Complete disappearance of Arctic sea ice in September 2018 is within the margins of a trend based on yearly annual minimum volume, as illustrated by the image on the right.

Latent heat can make such disappearance come abruptly and - for people who only look at changes in extent - rather unexpectedly.

Latent heat is energy associated with a phase change, such as the energy absorbed by solid ice when it changes into water (melting). During a phase change, the temperature remains constant.

Sea ice acts as a buffer that absorbs heat, while keeping the temperature at zero degrees Celsius. As long as there is sea ice in the water, this sea ice will keep absorbing heat, so the temperature doesn't rise at the sea surface.

The amount of energy absorbed by melting ice is as much as it takes to heat an equivalent mass of water from zero to 80°C.


Oceans take up over 90% of global warming, as illustrated by the image below. Ocean currents make that huge amounts of this heat keep entering the Arctic Ocean from the Pacific Ocean and the Atlantic Ocean.


Once the sea ice is gone, further ocean heat must go elsewhere, i.e. it will typically raise the temperature of the water. The atmosphere will also warm up faster. More evaporation will also occur once the sea ice is gone, which will cool the sea surface and warm up the atmosphere (technically know as latent heat of vaporization).

As temperatures in the Arctic are rising faster than at the Equator, the Jet Stream will change, making it easier for warm air to enter the Arctic. More clouds will form over the Arctic, which will reflect more sunlight into space, but which will also make that less outward IR radiation can escape into space over the Arctic, with a net warming effect.

Meanwhile, El Niño is getting stronger, as illustrated by above image on the right. A warmer Arctic comes with stronger heat waves, forest fires and associated emissions, and rapid warming of water in rivers that end in the Arctic Ocean, all of which will further warm up the Arctic Ocean. Forest fires have already been burning strongly in Siberia over the past few months and methane recently reached levels as high as 2817 ppb (on July 8, 2018, pm).

One huge danger is that, as the buffer disappears that until now has consumed huge amounts of ocean heat, and the Arctic Ocean keeps warming, further heat will reach methane hydrates at the seafloor of the Arctic Ocean, causing them to get destabilized and release methane.

[ The Buffer has gone, feedback #14 on the Feedbacks page ]
Additionally, disappearance of the sea ice will come with albedo changes that mean that a lot more sunlight will be absorbed, instead of getting reflected back into space as occurred previously.


Similar albedo changes are likely to take place over land in the Arctic soon thereafter. Adding up all warming elements associated with disappearance of the sea ice can result in an additional global warming of several degrees Celsius.

The situation is dire and calls for comprehensive and effective action, as described in the Climate Plan.


Links

• Can we weather the Danger Zone?
https://arctic-news.blogspot.com/2018/07/can-we-weather-the-danger-zone.html

• How much warmer is it now?
https://arctic-news.blogspot.com/2018/04/how-much-warmer-is-it-now.html

• Accelerating Warming of the Arctic Ocean
https://arctic-news.blogspot.com/2016/12/accelerating-warming-of-the-arctic-ocean.html

• High Temperatures Over Arctic Ocean In June 2018
https://arctic-news.blogspot.com/2018/06/high-temperatures-over-arctic-ocean-in-june-2018.html

• Feedbacks
https://arctic-news.blogspot.com/p/feedbacks.html

• Latent Heat
https://arctic-news.blogspot.com/p/latent-heat.html

• How much warming have humans caused?
https://arctic-news.blogspot.com/2016/05/how-much-warming-have-humans-caused.html

• The Threat
https://arctic-news.blogspot.com/p/threat.html

• Extinction
https://arctic-news.blogspot.com/p/extinction.html

• Climate Plan
https://arctic-news.blogspot.com/p/climateplan.html


Tuesday, April 17, 2018

Heat Storm

[ click on images to enlarge ]
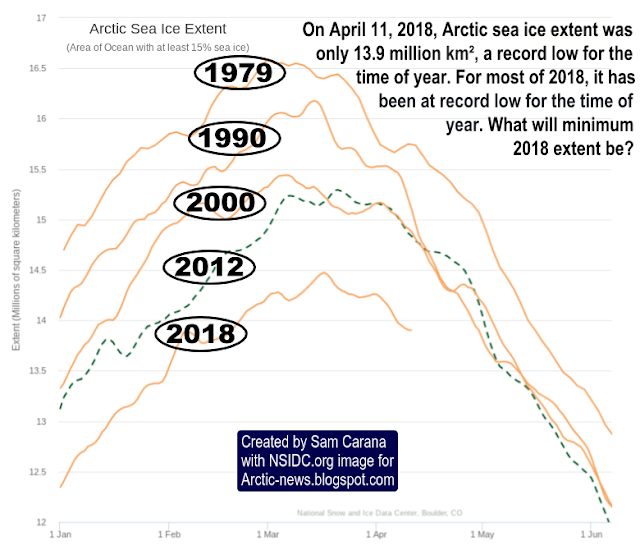
On April 11, 2018, Arctic sea ice extent was only 13.9 million km². Arctic sea ice extent has been at a record low for the time of year for most of 2018, as illustrated by above image. In 2012, extent went below 3.4 million km². The question is what minimum 2018 extent will be.

Arctic sea ice could disappear altogether in 2018. Have a look at the progressive loss of sea ice volume depicted in the image on the right, from an earlier post. Zero sea ice volume by 2018 is within the margins of the trend line contained in the data going back to 1979.

What drives volume decline is the combination of extent loss and especially thickness loss. Sea ice thickness has declined particularly where the ice once was at its thickest, i.e. north of Greenland and the Canadian Arctic Archipelago.

The combination image below shows the decline of the thicker sea ice, by comparing sea ice thickness on April 15 (run April 14) for the years 2015 through to 2018, showing that sea ice this year is entering the melting season with little or no thick sea ice left north of Greenland and the Canadian Arctic Archipelago to cope with the influx of warmer water.


The image below shows how much Bering Strait sea ice is at a historic low and the associated International Arctic Research Center post describes that this is caused by higher ocean temperatures and frequent storms.


The influx of warm water from the Atlantic Ocean and from the Pacific Ocean is melting the sea ice from below, while sunlight is melting the sea ice from above. Furthermore, warm water from rivers that end in the Arctic Ocean also contribute to melting of the sea ice, and there are numerous feedbacks that can dramatically speed up melting.

Disappearance of the sea ice means that the buffer that until now has consumed huge amounts of heat, will be gone and that heat that previously went into melting the sea ice, will instead warm up the Arctic.

Sea ice can be expected to continue its downward spiral, given the continued rise of the temperature of the sea surface in the North Atlantic Ocean and the North Pacific Ocean, as illustrated by the image below.


The sea surface is not necessarily the place where the water is at its warmest. This is illustrated by the image below, showing subsurface ocean heat in the area most relevant to El Niño/La Niña events.


[ click on images to enlarge ]
We're currently still in a La Niña period in which temperatures are suppressed, as illustrated by the Multivariate El Niño/Southern Oscillation (ENSO) Index image on the right.

As illustrated by the forecast plumes image underneath on the right, it looks like a new El Niño will arrive this summer, which will elevate temperatures from the trend.

This could result in a heat storm as early as summer 2018, in which heat waves could decimate the sea ice, while storms could push the remaining sea ice out of the Arctic Ocean.

This danger is further illustrated by the trend line in the image below, a trend that is contained in NASA LOTI data up to March 2018, adjusted by +0.79°C to better reflect the rise from preindustrial and surface air temperatures, and to better include Arctic temperatures.


[ click on images to enlarge ]
The temperature rise in the Arctic is causing decline of the sea ice extent as well as the extent of the snow cover on land.

The image on the right shows the progressive decline of the spring snow cover on land in the Northern Hemisphere.

A recent study shows that the amount of water melt from the glaciers on Mt. Hunter, Alaska, is now 60 times greater than it was before 1850.

Heat waves combined with strong rainfall due to storms could devastate the snow cover in 2018.

Decline of the snow and ice cover in the Arctic comes with a huge loss in albedo, which means that huge amounts of sunlight that were previously reflected back into space instead get absorbed by the Arctic.

The Buffer has gone, feedback #14 on the Feedbacks page
A rapid rise in temperatures in the Arctic will also accelerate changes to jet stream, which can cause huge amounts of heat from the Atlantic Ocean and the Pacific Ocean to enter the Arctic Ocean, further speeding up its warming and threatening to destabilize methane hydrates in sediments under the Arctic Ocean.

The methane will initially be felt most strongly in the Arctic, further speeding up Arctic warming which is already accelerating due to numerous feedbacks including - as said - the loss of the snow and ice cover in the Arctic, which makes that less sunlight is reflected back into space and instead adds to warming up the Arctic.

All this shouldn't come unexpected. In the video below, Guy McPherson warns that a rapid temperature rise will affect agriculture across the globe, threatening to cause a collapse of industrial civilization, in turn resulting in an abrupt halt of the sulfates that are currently co-emitted as a result of burning fuel, which will further add to a temperature rise that is already threatening to cause people across the globe to perish at massive scale, due to heatstroke, dehydration and famine, if not perish due to nuclear radiation and further toxic effects of war, as people fight over who controls the last habitable places on Earth.


Guy mentions the President of Finland, Sauli Niinistö, who in a press conference on August 28, 2017, warns that: "If we lose the Arctic, we lose the globe". The video below shows an extract of the press conference.


The situation is dire and calls for comprehensive and effective action, as described in the Climate Plan.

Links

• Climate Plan
https://arctic-news.blogspot.com/p/climateplan.html

• Feedbacks in the Arctic
https://arctic-news.blogspot.com/p/feedbacks.html

• How much warmer is it now?
https://arctic-news.blogspot.com/2018/04/how-much-warmer-is-it-now.html

• Extinction
https://arctic-news.blogspot.com/p/extinction.html

• Ten Dangers of Global Warming
https://arctic-news.blogspot.com/p/ten-dangers-of-global-warming.html

• Methane Erupting From Arctic Ocean Seafloor
https://arctic-news.blogspot.com/2017/03/methane-erupting-from-arctic-ocean-seafloor.html

• Warning of mass extinction of species, including humans, within one decade
https://arctic-news.blogspot.com/2017/02/warning-of-mass-extinction-of-species-including-humans-within-one-decade.html

• In the coastal communities near the Bering Strait, a winter unlike the rest
https://www.climate.gov/news-features/features/coastal-communities-near-bering-strait-winter-unlike-rest

• A 400‐Year Ice Core Melt Layer Record of Summertime Warming in the Alaska Range
https://agupubs.onlinelibrary.wiley.com/doi/abs/10.1002/2017JD027539

• Warning Signs
https://arctic-news.blogspot.com/2018/03/warning-signs.html


Tuesday, January 2, 2018

Unfolding Arctic Catastrophe

On January 1, 2018, methane levels as high as 2764 ppb (parts per billion) were recorded. The solid magenta-colored areas near Greenland indicate that this very high reading was likely caused by methane hydrate destabilization in the sediments on the seafloor of the Arctic Ocean.


The state of the sea ice is behind this. On January 1, 2018, Arctic sea ice extent was at record low for the time of the year. The smaller the extent, the less sunlight gets reflected back into space and is instead absorbed in the Arctic.

At this time of year, though, hardly any sunshine is reaching the Arctic. So, what triggered this destabilization? As the image below indicates, year-to-date average Arctic sea ice volume has been at record low in 2017, which means that there has been very little sea ice underneath the surface throughout 2017.


Warm water will melt the sea ice from below, which keeps the water at greater depth cool. However, when there is little or no sea ice underneath the surface, little or no heat will be absorbed by the process of melting and the heat instead stays in the water, with the danger that it will reach sediments at the bottom of the Arctic Ocean, as illustrated by the image below.

The Buffer has gone, feedback #14 on the Feedbacks page
[ image from: Warming is accelerating ]
The image on the right shows warm water from the North Atlantic arriving near Svalbard. How warm is the water beneath the surface of the Arctic Ocean? The image below gives an indication, showing how much warmer the water was from October 1, 2017, to December 30, 2017, at selected areas near Svalbard, where warm water from the North Atlantic dives under the sea ice of the Arctic Ocean, carried by the Gulf Stream.

[ click on images to enlarge ]
In 1981-2011, temperatures were gradually falling by more than one degree Celsius from October 1 to the December 21 Solstice, then started to rise again in line with the change in seasons (blue line). In 2017, temperatures were rising in October. On October 25, 2017, the sea surface was as warm as 17.5°C or 63.5°F, i.e. a 14.1°C or 24.5°F anomaly. On average, it was 12.96°C or 23.35°F warmer during the period from October 1 to December 30, 2017 (red line), compared to the same days in 1981-2011.

The images below further illustrate the situation. Surface temperature of the atmosphere near Svalbard was as warm as 7°C or 44.5°F on January 13, 2018 (at green circle, left panel). The sea surface near Svalbard was as warm as 15.9°C or 60.8°F on January 12, 2018, compared to 2.4°C or 36.4°F on January 12 for the period 1981-2011 (at green circle, center panel). Waves as high as 13.04 m or 42.8 ft (at green circle, right panel) batter the North Atlantic along Norway's coast all the way to Svalbard on January 15, 2018.


The image below shows that waves as high as 16.01 m or 52.5 ft are forecast to batter the North Atlantic on January 16, 2018 (green circle, left panel). 100% relative humidity is recorded over the Arctic Ocean on January 15, 2018 (green circle, center panel). The Jet Stream reaches speeds as high as 426 km/h or 264 mph on January 15, 2018 (green circle, right panel).


Similar extreme weather patterns can be seen elsewhere in the Arctic. The image below on the left shows that temperatures as high as 18.5°C or 65.3°F were recorded on Jan. 14 and 15, 2018 in Metlakatla, Alaska. The image below on the right shows that surface temperatures as high as 7.4°C or 45.2°F were reached on January 16, 2018, in Yukon Territory, Canada (at green circle).

[ click on images to enlarge ]

In conclusion, as the Arctic is warming up faster than the rest of the world, Jet Streams are getting more wavy, resulting in more extreme weather events. Wind speed accelerates over warmer oceans, pushing more heat into the Arctic Ocean, threatening to cause eruptions of huge amounts of methane from the Arctic Ocean seafloor.

The situation is dire and calls for comprehensive and effective action as described at the Climate Plan.


Links

• Climate Plan
https://arctic-news.blogspot.com/p/climateplan.html

• Warming is accelerating
https://arctic-news.blogspot.com/2017/11/warming-is-accelerating.html

• Feedbacks
https://arctic-news.blogspot.com/p/feedbacks.html

• 10°C or 18°F warmer by 2021?
https://arctic-news.blogspot.com/2017/04/10c-or-18f-warmer-by-2021.html

• Abrupt Warming - How Much And How Fast?
https://arctic-news.blogspot.com/2017/05/abrupt-warming-how-much-and-how-fast.html

• Accelerating growth in CO₂ levels in the atmosphere
https://arctic-news.blogspot.com/2017/02/accelerating-growth-in-co2-levels-in-the-atmosphere.html

• High methane levels over the Arctic Ocean on January 14, 2014
https://arctic-news.blogspot.com/2014/01/high-methane-levels-over-the-arctic-ocean-on-january-14-2014.html

• Extinction
https://arctic-news.blogspot.com/p/extinction.html

• Methane Erupting From Arctic Ocean Seafloor
https://arctic-news.blogspot.com/2017/03/methane-erupting-from-arctic-ocean-seafloor.html

• 2015 warmest year on record
https://arctic-news.blogspot.com/2015/12/2015-warmest-year-on-record.html

• Accelerating Warming of the Arctic Ocean
https://arctic-news.blogspot.com/2016/12/accelerating-warming-of-the-arctic-ocean.html

• Arctic Ocean Feedbacks
https://arctic-news.blogspot.com/2017/01/arctic-ocean-feedbacks.html

• Warning of mass extinction of species, including humans, within one decade
https://arctic-news.blogspot.com/2017/02/warning-of-mass-extinction-of-species-including-humans-within-one-decade.html