Showing posts with label cyclone. Show all posts

Monday, August 12, 2013

Cyclone raging on Thin Ice

Another cyclone is raging over the Arctic Ocean. The Naval Research Laboratory image below shows the speed and drift of the sea ice.

[ click on image to enlarge ]
Last time a cyclone hit the Arctic, this resulted in a temporary increase in area covered by sea ice, as shown on the Cryosphere Today image below. The cyclone pushed down on the sea ice, flattening it and pushing it sideways. 


Note that area as measured by the Cryosphere Today includes all spots that have a 15% or higher concentration of ice. This way of measuring area ignores the fact that the cyclone reduced the sea ice concentration in many spots, from a high sea ice concentration (around 90%) to a lower concentration (less than 80%), as shown on the Naval Research Laboratory image below. 


Furthermore, sea ice has since dropped in thickness, as illustrated by the Naval Research Laboratory image below. 

Much of the ice is now less than one meter thick, while some areas close to the North Pole have ice that is only between zero and half a meter thick.

The cyclone is raging most fiercely in those areas and much of the ice is drifting out into the Atlantic Ocean.

Neven mentioned at the Arctic Sea Ice Blog that average thickness (crudely calculated by dividing PIOMAS (PI) volume numbers with Cryosphere Today (CT) sea ice area numbers, see image below) had a very steep drop in July, similar to the drop in 2010. This year's trend line is now lowest, probably signifying that the ice pack is spread out and thin at the edges (read: melting potential).

[ click on image to enlarge ]
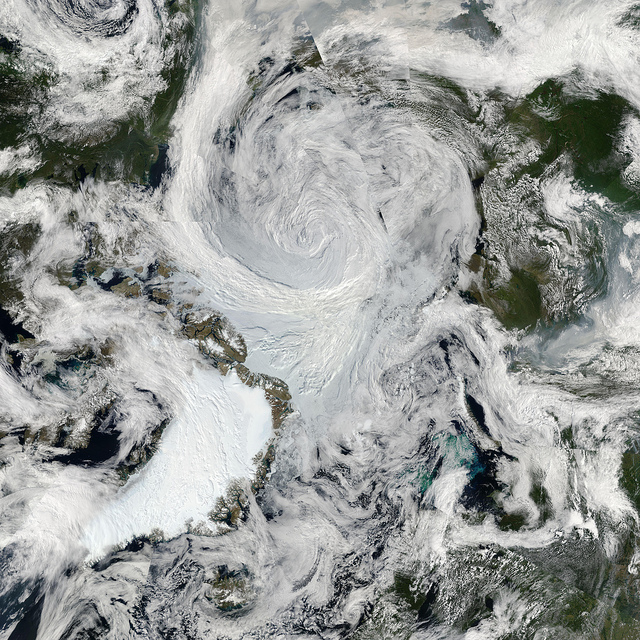
The image below, from the University of Bremen, Germany, shows sea ice concentration on August 11, 2013.


Wednesday, August 7, 2013

Another Arctic cyclone brewing

Another cyclone is brewing in the Arctic. Below are Naval Research Laboratory projections of sea ice drift a few days ahead.

[ click on image to enlarge ]
The image below, from Danmarks Meteorologiske Institut (DMI), shows surface pressure over the Arctic Ocean on August 7, 2013.

from: http://ocean.dmi.dk/arctic/weather/arcticweather.uk.php

Below are two projections of pressure and wind direction for August 11 and August 15, 2013.


edited screenshots from animation at weather-forecast.com
A further post with more details on this cyclone will be added soon.


Saturday, July 27, 2013

Arctic Cyclone July 2013

A cyclone is raging over Arctic.


Above satellite image is from weather.gc.ca with further images added in the video below (July 25-27, 2013). To see the video in a larger size, go to https://youtube.googleapis.com/v/YgoHBAMw_Mc


Below, a Naval Research Laboratory animation showing ice speed and drift over 30 days.


The impact of the cyclone is also clearly visible on the Naval Research Laboratory ice concentration animation below.


Related

- The Great Arctic Flush - by Paul Beckwith
http://arctic-news.blogspot.com/2013/07/the-great-arctic-flush.html

Sunday, July 21, 2013

The Great Arctic Flush

By Paul Beckwith

A massive cyclone is forecast to develop in the Arctic, as shown on the image below, from the Naval Research Laboratory.

Within 2 weeks the Arctic Ocean will be completely transformed. The cyclone that appears 6 days out on both the US and European ten day forecasts will massacre the sea ice in what I call "The Great Arctic flush".

The image below is a forecast for Arctic sea ice speed and drift on July 27, 2013. More images, including animations, on Arctic sea ice can be viewed at http://www7320.nrlssc.navy.mil/hycomARC/arctic.html 


Last August, a massive cyclone formed over the Arctic Ocean and destroyed 800,000 square km of ice in about a week. The predicted cyclone looks to be as strong as the one in early August, 2012. Problem is, the ice is much weaker, thinner and fractured this year; including all the ice just north of the Canadian Arctic Archipelago that is 4 or 5 meters thick; this ice is mobile, broken, fractured ice piled up into ridges; it is not multiyear ice (MYI) at all.

Above image, from the Naval Research Laboratory is a prediction of ice speed and drift a week from now, showing the motion of the ice, the darker and redder the faster, the ice is being set in motion by the cyclone above. Since the Coriolis force flings things to the right, the ice is all sent to the outside of the rotation, into the warmer surrounding water as well as the Atlantic Ocean. The storm surge of a foot or two over the entire basin (highest near the cyclone eye) will draw in warm water from the Pacific via the Bering Strait and from the Atlantic via the Fram Strait. It will also mix the fresh water on the surface from melting ice with warmer saltier water from below. It will also generate lots of churning and grinding of the ice and waves several meters high. Warm and smoky air that is filled with ash and black carbon from burning fires in the far north will drop the albedo of the ice and increase the solar absorption. 

When I forecast zero sea ice at the end of the melt season this summer, I fully expected at least one or more of these massive cyclonic storms. Last year it occurred in early August, and lasted for about 8 days. In the rest of the melt season last year no other huge cyclone developed, although several small ones did. Perhaps the cyclone disturbed the ocean conditions enough to prevent subsequent ones occurring. We shall see this year...

edited screenshot from animation at weather-forecast.com


Paul Beckwith is a part-time professor with the laboratory for paleoclimatology and climatology, department of geography, University of Ottawa. He teaches second year climatology/meteorology. His PhD research topic is “Abrupt climate change in the past and present.” He holds an M.Sc. in laser physics and a B.Eng. in engineering physics and reached the rank of chess master in a previous life.

Friday, July 19, 2013

Arctic Ocean Events - Videos by Paul Beckwith

by Paul Beckwith


Massive Arctic cyclone effect on sea ice in August 2012
Part 1: August 1st to 16th, 2012
http://www.youtube.com/watch?v=nli47-9dT5o

Arctic sea ice motion (speed and direction) is compared to sea ice thickness from August 1st to August 16th, 2012. Sea ice motion is then compared to meteorology (500 mb pressure heights and 200 mb vector winds).


Massive Arctic cyclone effect on sea ice in August 2012
Part 2: August 1st to 16th, 2012
http://www.youtube.com/watch?v=WqwIVEpSg3w

Northern hemisphere meteorology (500mb pressure heights) and Arctic sea ice concentration compared to SST (sea surface temperatures) are examined from August 1st to August 16th, 2012 encompassing the mass persistent cyclone.


Massive Arctic cyclone effect on sea ice in August 2012
Part 3: August 1st to 16th, 2012
http://www.youtube.com/watch?v=HjYxRV0fzz4

Arctic basin SSS (sea surface salinity) is compared to SSH (sea surface height) during the period August 1st to August 16th, 2012 which encompassed a massive persistent cyclone. Detailed meteorology is also examined (tropopause temperature + pressure, surface precipitable water + pressure). Also examined is ocean profile salinity and temperature from an ice tethered buoy.


Massive Arctic cyclone effect on sea ice in August 2012
Part 4:  August 1st to 16th, 2012
http://www.youtube.com/watch?v=aAJRIV8YITY

The jet streams in the Arctic ocean basin are shown (200mb vector winds) from NOAA/ESRL daily data, as well as from 4 times daily data from SFSU. The data is given from August 1st to August 16th, 2012 which encompasses the massive Arctic cyclone.


2013

Arctic sea ice thickness + motion
May 14th to June 10th, 2013
http://www.youtube.com/watch?v=5ljHI0VITgk

Arctic sea ice data from May 14 to June 10, 2013
Left pane shows Arctic sea ice thickness; right pane shows sea ice motion (direction and speed).


Arctic sea ice thickness + motion
July 1st to 17th 2013
http://www.youtube.com/watch?v=cUZr51_yW5s

Arctic sea ice data from July 1st to July 17th, 2013. Left pane shows the Arctic sea ice thickness; right pane shows sea ice motion (direction and speed).


Sea ice concentration, temperature, salinity, and height;
July 1st to 18th, 2013
http://www.youtube.com/watch?v=icUtGqpkFx8

Arctic ocean data from US Navy for
1) sea ice concentration,
2) sea surface temperature (SST),
3) sea surface salinity (SSS), and
4) sea surface height (SSH)


Jet streams
July 1st to July 17th 2013
http://www.youtube.com/watch?v=IFbJCFVSiPI

Northern hemisphere (NH) jet streams are shown from two sources:
1) NOAA/ESRL data collected daily, and
2) SFSU data collect every 6 hours. Data is given for the time period from July 1st to July 17th, 2013.


Meteorology
July 1st to 18th 2013
http://www.youtube.com/watch?v=LONJT8JbM7I

The following meteorology plots are shown for time period July 1st to July 18th, 2013 over the Arctic Ocean between 60 degrees N and 90 degrees N:
1) 500mb pressure levels,
2) 200mb vector winds (jet streams),
3) precipitable water, and
4) tropopause temperatures.

Tuesday, June 4, 2013

Update on Arctic Snow and Ice


Above image, adapted from the National Snow and Ice Data Center (NSIDC), shows that Arctic sea ice extent has roughly followed the same path it did in 2012 when it reached a historic record low. Highlighted on above image is the highest extent the sea ice reached in 2013, i.e. 15,113 million square km on May 14, 2013.

Saturday, September 8, 2012

Update on September Arctic cyclone

By Paul Beckwith, 
edited by Sam Carana


The loss of Arctic sea ice appears to be flattening out at the moment. The above image shows Arctic sea ice extent (total area of at least 15% ice concentration) for the last 7 years, compared to the average 1972-2011, as calculated by the Polar View team at the University of Bremen, Germany.

Paul Beckwith, B.Eng, M.Sc. (Physics),
Ph. D. student (Climatology) and
Part-time Professor, University of Ottawa
 
However, Paul Beckwith warns that Hurricane Leslie looks set to capture Hurricane Michael just off the Canadian maritimes and strongly impact Nova Scotia and Newfoundland (large hurricane), to then continue northward and start to affect Arctic climate by compressing isobars creating large pressure gradients and thus high winds.

Paul points at the image below, from weather.unisys.com/gfsx, showing a 9 day GFSx model for Arctic region.

The model shows that an Arctic cyclone is amplified as a result of Leslie and a strong high pressure ridge is also generated over the Beaufort Sea. As the Arctic cyclone decreases in strength a strong cyclone is generated over Alaska.

“Needless to say this scenario would be very destructive to Arctic sea ice if it plays out,” Paul adds.  “Also, there is no apparent decrease in Arctic sea surface temperatures in projections out to September 12th, and no apparent salinity change. I will be amazed if this melt season does not last until the end of September or even into early October.”


View Paul Beckwith's September 8 presentation by clicking on the following link:
https://docs.google.com/file/d/0ByLujhsHsxP7QndrZjdKX2szTHM/edit


Or, view the presentation in the window below (it may take some time for the file to fully load).

Tuesday, September 4, 2012

Arctic cyclone warning for September 7

By Paul Beckwith, 
edited by Sam Carana
Paul Beckwith, B.Eng, M.Sc. (Physics),
Ph. D. student (Climatology) and
Part-time Professor, University of Ottawa
 

Paul Beckwith warns that another cyclone is forecast to develop in the Arctic by September 7th, 2012, pointing at the image below, from the Naval Research Laboratory.

“This will cause lots of sea ice breakup in the Arctic if it develops and persists”, Paul says.  “The sea ice now is thinner than in August, so the potential for severe damage to ice exists. On the other hand, however, the August cyclone lasted for a week, while this one looks like a 2 to 3 day event.”

Paul also points at the image further below, from weather.unisys.com/gfsx, showing a 9 day GFSx model for Arctic region; on the website you can select single day panels.


“Most scientists think that the massacre of Arctic sea ice will stop on/or around September 15th which is the 'normal' date at which ice formation is due, as the decrease of solar insolation at the pole will cause the area of the sea ice to start increasing", Paul says, adding however that “a minority of us think that the melt will continue beyond this date by several weeks, due to the warmness of the sea water both beside and below the very thin sea ice.”

Paul continues: “In fact, I predicted on August 10th that at the end of the melt season there would be virtually no sea ice left; this was predicated on there being a few more cyclones of equal intensity to that of the August 2nd to August 10th cyclone that eliminated around 0.8 million square kilometers of sea ice area (equivalent to about 20% of the ice remaining in 2007, the previous worst year in terms of ice melt). Thankfully, my prediction looks to be wrong, but we are not out of the woods yet. It appears that a strong cyclone will be attacking the sea ice in a few days, with the peak churning occurring on September 7th.”

The 500mb/SLP chart shows the 500 mb height (in color contours), and the sea level pressure in mb (black lines).

The image below, also from the Naval Research Laboratory, is an animation showing sea ice speed and drift over 30 days, from early August up to September 9, and including the forecast cyclone event.

Friday, August 31, 2012

Paul Beckwith on ice speed and drift - update 1


Above image shows Arctic sea ice extent (total area of at least 15% ice concentration) for the last 7 years, compared to the average 1972-2011, as calculated by the Polar View team at the University of Bremen, Germany.

View Paul Beckwith's August 30 presentation on sea ice speed and drift by clicking on the following link:
https://docs.google.com/file/d/0ByLujhsHsxP7VTlsczIyalpjNDQ/edit


Or, view the presentation in the window below (it may take some time for the file to fully load).

Saturday, August 25, 2012

Cyclone Warning

By Harold Hensel, edited by Sam Carana

The Google Earth view below shows an Arctic Cyclone going over Alaska and entering the Arctic Ocean.

Arctic - Google Earth view
The warm rain and wind will further deteriorate the North Pole Ice Cap.

In case you're looking for news in Tropical Storm ISAAC, see the images below.

Tropical Storm ISAAC - Google Earth view
Tropical Storm ISAAC - NOAA image
Above image and the image below are from the NOAA National Hurricane Center. For updates on ISAAC, check that site!
Tropical Storm ISAAC - NOAA image


Friday, August 17, 2012

Arctic sea ice updates


Above diagram shows sea ice extent as calculated by the Polar View team at the University of Bremen, Germany.

Paul Beckwith warns that a second cyclone is threatening to batter the remaining sea ice soon.

View Paul's presentation by clicking on the link below.
https://docs.google.com/file/d/0ByLujhsHsxP7cnB0bXhNNFFSQjQ/edit


Or, view the presentation in the window below (it may take some time for the file to fully load).

Tuesday, August 14, 2012

Sea ice extent update August 14, 2012

The National Snow and Ice Data Center (NSIDC) at the University of Colorado has released an update. Excerpts follow below, for the full post, see A summer storm in the Arctic.

Arctic sea ice extent during the first two weeks of August continued to track below 2007 record low daily ice extents. As of August 13, ice extent was already among the four lowest summer minimum extents in the satellite record, with about five weeks still remaining in the melt season.

Arctic sea ice extent as of August 13, 2012. Credit: National Snow and Ice Data Center
The average pace of ice loss since late June has been rapid at just over 100,000 square kilometers (38,000 square miles) per day. However, this pace nearly doubled for a few days in early August during a major Arctic cyclonic storm, discussed below.

Unlike the summer of 2007 when a persistent pattern of high pressure was present over the central Arctic Ocean and a pattern of low pressure was over the northern Eurasian coast, the summer of 2012 has been characterized by variable conditions. Air tempertures at the 925 hPa level (about 3000 feet above the ocean surface) of 1 to 3 degrees Celsius (1.8 to 5.4 degrees Fahrenheit) above the 1981 to 2012 average have been the rule from central Greenland, northern Canada, and Alaska northward into the central Arctic Ocean. 

Cooler than average conditions (1 to 2 degrees Celsius or 1.8 to 3.6 degrees Fahrenheit) were observed in a small region of eastern Siberia extending into the East Siberian Sea, helping explain the persistence of low concentration ice in this region through early August.

August 6, 2012, 06:00 GMT surface weather analysis, showing a very strong cyclone over the central Arctic Ocean north of Alaska. The isobars (lines of equal pressure) are very tightly packed around the low pressure system, indicating strong winds. Greenland is on the right side of the figure, Canada at the bottom. Credit: Canadian Meteorological Centre
A low pressure system entered the Arctic Ocean from the eastern Siberian coast on August 4 and then strengthened rapidly over the central Arctic Ocean. On August 6 the central pressure of the cyclone reached 964 hPa, an extremely low value for this region. It persisted over the central Arctic Ocean over the next several days, and slowly dissipated. The storm initially brought warm and very windy conditions to the Chukchi and East Siberian seas (August 5), but low temperatures prevailed later.

On three consecutive days (August 7, 8, and 9), sea ice extent dropped by nearly 200,000 square kilometers (77,220 square miles). This could be due to mechanical break up of the ice and increased melting by strong winds and wave action during the storm.

The image below, from the Danish Meteorological Institute (DMI), shows that sea ice extent took a huge dive early August and has consolidated since, as the winds settled down.

Credit: Centre for Ocean and Ice, Danish Meteorological Institute
Note that, to calculate extent, DMI includes areas with ice concentration higher than 30% (NSIDC includes areas that show at least 15% sea ice). 

Another Arctic Cyclone brewing

Paul Beckwith fears that another Arctic cyclone could be starting up about 5 days from now. 

GFSx model shows it churning from about August 19th or 20th onward to the end of the forecast (at least for 5 days+). It appears that this storm will be positioned closer to the Atlantic side, and be north of Greenland. 

There will be a very high pressure mass of warm air over Greenland and the cyclonic flow will be pushing ice toward the Atlantic. Paul stands by his prediction of no sea ice in the Arctic by September 30th. There still is some 30 to 40+ days of melt season left. Paul adds that the 40+ days will more likely apply due to warmer water from storm churning.

Paul Beckwith, B.Eng, M.Sc. (Physics), Ph. D. student (Climatology); Part-time Professor, University of Ottawa

View Paul's presentation by clicking on the link below:
https://docs.google.com/open?id=0ByLujhsHsxP7dUQwYXJ6bXRSd00

Or, view the presentation in the window below (it may take some time for the file to fully load).

Saturday, August 11, 2012

Huge cyclone batters Arctic sea ice

The image below shows an unusually large and powerful cyclone that was churning over the Arctic in early August 2012. Two smaller systems merged on August 5 to form the storm, which at the time occupied much of the Beaufort-Chukchi Sea and Canadian Basin, reports NASA Earth Observatory. On average, Arctic cyclones last about 40 hours; as of August 9, 2012, this storm had lasted more than five days.

This cyclone’s central sea level pressure reached about 964 millibars on August 6, 2012—a number that puts it within the lowest 3% of all minimum daily sea level pressures recorded north of 70 degrees latitude, noted Stephen Vavrus, an atmospheric scientist based at the University of Wisconsin.

Image by By NASA Goddard Photo and Video
NASA’s Aqua satellite captured above natural-color mosaic image on August 6, 2012. The center of the storm at that date was located in the middle of the Arctic Ocean.

The combined screenshots (6 & 8 August) below from Oceanweather Inc give an idea of size of the waves churned up by the cyclone.


The storm came in from Siberia, intensified and then positioned itself over the central Arctic, engendering 20 knot winds and 50 mph wind gusts, reports Skeptical Science.

The Arctic Sea Ice Blog covered the unfolding events well, in a series of posts including:
Many excellent comments were also added underneath these posts, e.g. by Steve Coulter who noted that "when fragmented floes are present, each irregular piece of ice acts as a sail in the wind, so the wind transfers momentum more readily to the surface. And each piece of ice, being 90% submerged, quite effectively transfers that momentum to the water. With winds moving in essentially a single direction in any given area, vast volumes of surface water are more readily put into motion. The difference in motion between the surface and deep water inevitably creates mixing."

Such mixing could mean that sediments that have been frozen until now get exposed to warmer water. This could destabilize methane contained in such sediments, either in the form of free gas or hydrates.

John Nissen, Chair of the Arctic Methane Emergency Group (AMEG), comments:
"There are at least three positive feedbacks working together to reinforce one another - and now a fourth on salinity:
  1. The albedo flip effect as sea ice is replaced by open water absorbing more sunlight, warming and melting more sea ice.
  2. As the sea ice gets very thin, it is liable to break up easily and get blown into open water where it will melt more easily.
  3. The open warmer water is allowing increased strength of storms, which break up the ice to make for more open water.
  4. The storms are churning up the sea to a depth of 500 metres, producing salinity at the surface that will mean slower ice formation in winter and more open water next year.
These feedbacks are dangerous for methane. AMEG has been warning that, as the sea ice retreats, storms will warm the sea bed, leading to further release of methane. In ESAS, we only need mixing to a depth of 50 metres - so a storm capable of mixing to 500 metres will really stir things up.

These feedbacks are also dangerous for food security, already damaged through climate extremes induced by Arctic warming, hence our piece in the Huffington Post.

The only way to head off catastrophe is to cool the Arctic, which must involve geoengineering as quickly as possible. We must try to remain positive and determined about this, despite the gloomy news."


Above image shows a retreat in sea ice area to 3.15521 million km2 on the 221st day of 2012, down from 3.91533 million km2 on the 212th day of 2012, from The Cryosphere Today.

The 30-days animation below, from the Naval Research Laboratory, show the recent ice speed and drift.


The 30-days animation below, also from the Naval Research Laboratory, show recent decline of the thickness of the sea ice.  


Friday, August 10, 2012

Sea ice in the Arctic - Shaken and stirred (by a powerful cyclone)

By Paul Beckwith


From my chair, it looks to me like there will be zero sea ice in the Arctic by September 30th of this year 2012.

The massive cyclone in the Arctic of unprecedented size has been chewing up the sea ice for the last week and it looks like over 1 million square km has been lost. A few more cyclones there will finish it off completely.

My presentation on the link below needs polishing, is quite technical in places and is mostly my compilation of blogs and data and comments from other scientists, engineers, and lay-people. It is mostly in chronological order as the storm has progressed.

Sea ice in the Arctic - Shaken and stirred (by a powerful cyclone)
August 3 to 10, 2012, by Paul Beckwith

https://docs.google.com/open?id=0B7jFQnAaMpkXVFNLRUhXUmdaWk0