Showing posts with label SST. Show all posts

Saturday, April 23, 2016

More and more extreme weather

The weather is getting more and more extreme. On April 23, 2016, temperatures in India were as high as 47.7°C or 117.9°F. At the same time, temperatures in California were as low as -12.6°C or 9.2°F, while temperatures in Greenland were as high as 3.6°C or 38.6°F. Meanwhile, Antarctica was as cold as -60°C or -76°F.


The situation in India is most worrying. Temperatures are very high in many locations. India has been experiencing heatwave conditions for some time now, as reported in this and in this earlier posts.


[ click on images to enlarge ]
More extreme weather goes hand in hand with changes that are taking place to the jet stream, as also discussed in earlier posts (see further below).

As the Arctic warms up more rapidly than the rest of the world, the temperature difference between the Equator and the North Pole decreases, which in turn weakens the speed at which the north polar jet stream circumnavigates the globe. This is illustrated by the wavy patterns of the north polar jet stream in the image on the right.

The outlook for the next week shows the north polar jet stream move higher over the arctic, and to eventually disintegrate altogether, while merging with the subtropical jet stream over the Pacific Ocean.

The video below shows how a very wavy jet stream is projected to disintegrate over the Arctic Ocean over the coming week.


This makes it easier for warm air to move into the Arctic and for cold air to move out of the Arctic, in turn further decreasing the temperature difference between the Equator and the North Pole, in a self-reinforcing feedback loop: "It's like leaving the freezer door open."

Temperature forecasts for the Arctic Ocean are high, with anomalies projected to be above 4°C for the Arctic over the coming week.

The image on the right shows one such forecast, projecting a temperature anomaly of 5.31°C or 9.56°F for the Arctic on April 27, 2016, 1500 UTC, while an earlier forecast projected a 5.34°C or 9.61°F anomaly (hat tip to Mark Williams).

The danger is that the combined impact of high air temperatures and ocean heat will cause rapid demise of Arctic sea ice over the next few months.


On April 22, 2016, the sea surface was as much as 11.3°C or 20.3°F warmer than 1981-2011 (at the location off the coast of North America marked by the green circle).

High ocean heat is further accelerating Arctic sea ice demise, as the Gulf Stream keeps carrying ever warmer water into the Arctic Ocean. The image below, created with an image from the JAXA site, shows that Arctic sea ice extent was well under 13 million kmon April 19, 2016, and about 1 million km less than the extent in the year 2012 around this time of year.


Demise of the sea ice will cause even more rapid warming of the Arctic Ocean, with the danger that more heat will penetrate sediments that contain huge amounts of methane in the form of hydrates and free gas, threatening to trigger huge methane releases and cause runaway warming.

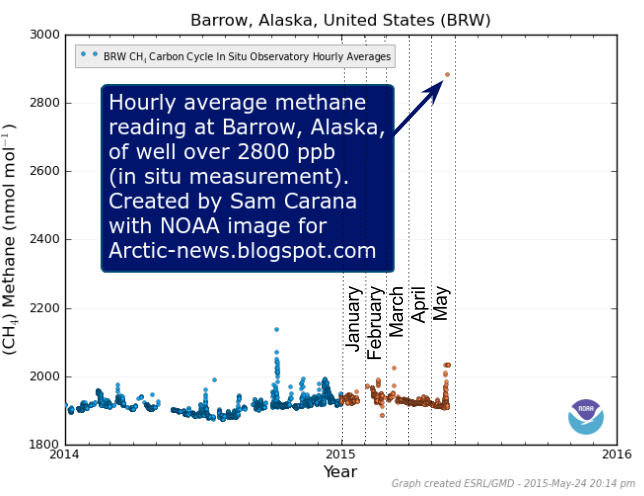
Methane levels are increasing strongly. This may not be as noticeable when taking samples from ground stations, but the rise is dramatic at higher altitudes, as also discussed earlier in this post and in this post.

Methane levels in ppb (parts per billion, at bottom of image)


The situation is dire and calls for comprehensive and effective action, as described at the Climate Plan.


Related

- What's wrong with the weather?

Friday, August 7, 2015

Record High Methane Levels

[ click on images to enlarge ]
As the top image shows, sea surface temperature anomalies in the Bering Strait on August 4, 2015, were as high as 8.7°C (15.6°F). Such high anomalies are caused by a combination of ocean heat, of heatwaves over Alaska and Siberia extending over the Bering Strait, and of warm river water run-off.

As the image on the right shows, sea surface temperatures in the Bering Strait were as high as 20.5°C (69.1°F) on August 4, 2015.

As warm water flows through the Bering Strait into the Arctic Ocean, it dives under the sea ice and becomes harder to detect by satellites that typically measure water temperatures at the surface, rather than below the surface.

The image below shows sea surface temperature anomalies from 1971 to 2000, for August 6, 2015, as visualized by Climate Reanalyzer.


Climate Reanalyzer applies a mask over sea-ice-covered gridcells, reducing anomalies in such cells to zero.

Below is a NOAA image, for August 5, 2015, also with anomalies from 1971 to 2000.


Below is another NOAA image, showing anomalies for August 6, 2015. Because the base period is 1961 to 1990, the anomalies are higher. Nonetheless, the yellow areas that feature around the North Pole on above image do not show up on the image below.


In other words, looking at sea surface temperatures alone may lead to underestimations of the temperatures of the water underneath the sea ice. Keeping that in mind, have a look again at the high anomalies on the image below.


The danger is that further decline of the sea ice will lead to rapid warming of the Arctic Ocean, while the presence of more open water will also increase the opportunity for strong storms to develop that can mix high sea surface temperatures all the way down to the seafloor, resulting in destabilization of sediments and triggering releases of methane that can be contained in such sediments in huge amounts.

The image below shows that global mean methane levels as high as 1840 parts per billion (ppb) were recorded on August 4, 2015. Peak methane levels that day were as high as 2477 ppb.


This peak level of 2477 ppb isn't the highest recorded the year. As the image below shows and as discussed in a previous post, methane levels as high as 2845 ppb were recorded on April 25, 2015. The average of the daily peaks for this year up to now is 2355 ppb. Very worrying about the above image are the high levels of methane showing up over the Arctic Ocean.


As above image also shows, the mean methane level of 1840 ppb is in line with expectations, as methane levels rise over the course of the year, to reach a maximum in September. This mean level of 1840 ppb is higher than any mean level since records began.

The image below shows all the World Meteorological Organisation (WMO) annual means that are available, i.e. for the period 1984 through to 2013.


As above image shows, a polynomial trendline based on these WMO data (for the period 1984 through to 2013) points at a doubling of mean global methane levels by about 2040. The added NOAA data are the highest mean in 2014, i.e. 1839 ppb recorded on September 7, 2014, and the above-mentioned level of 1840 ppb recorded on August 4, 2015.

As said, mean global methane levels last year reached its peak in September and the same is likely to occur this year. In other words, this new record is likely to be superseded by even higher levels soon.

The image on the right shows the steady rise of the highest mean daily methane levels that have been recorded recently, indicating that a continued rise can be expected that would put another highest mean level for 2015 on the trendline of above image soon.

Again, the danger is that a warming Arctic Ocean will trigger further methane releases from the seafloor, leading to rapid local warming that in turn will trigger further methane releases, in a vicious cycle of runway warming.

As illustrated by the image on the right, at a 10-year timescale, the current global release of methane from all anthropogenic sources exceeds all anthropogenic carbon dioxide emissions as agents of global warming.

Over the next decade or so, methane emissions are already now more important than carbon dioxide emissions in driving the rate of global warming, and this situation looks set to get worse fast.

Unlike carbon dioxide, methane's GWP does rise as more of it is released. Higher methane levels cause depletion of hydroxyl, which is the main way for methane to be broken down in the atmosphere.

The situation is dire and calls for comprehensive and effective action as discussed at the Climate Plan.  


The image shows all the World Meteorological Organisation (WMO) annual means that are available, i.e. for the period...
Posted by Sam Carana on Friday, August 7, 2015

Wednesday, July 8, 2015

Fracturing of the Jet Stream

Earlier this month, the jet stream was forecast to move over the Arctic Ocean north of Siberia on July 8, 2015, 12:00 UTC, in one, strong, long stream of wind, as discussed in the previous post and depicted below.


The situation has meanwhile been adjusted in a more recent forecast. This recent forecast shows the jet stream getting fractured over Siberia on July 8, 2015, 12:00 UTC, resulting in a sequence of vertical wind streams. This is a new development, rather unknown to the forecasting model that works on the basis of the jet stream flowing horizontally in one strong and narrow stream around the globe.


A further forecast has been added in the bottom panel, i.e. for July 12, 2015, 12:00 UTC, showing the jet stream moving well over the Arctic Ocean in two places, over the East Siberian Sea and over the Canadian Archipelago.

Fracturing of the jet stream and alignment along longitude, rather than latitude, is a worrying development. It is the most extreme form of what is described at Feedbacks in the Arctic as the "Open Doors" feedback or feedback #10, a feedback that makes it easier for warm air to move into the Arctic and for cold air move out of the Arctic, each of which will further contribute to a smaller temperature difference between the Equator and the North Pole, thus further changing the jet stream, in a self-reinforcing spiral.

The jet stream used to act as a barrier, keeping cold air in the Arctic and keeping temperate air in the temperate zone. As the jet stream fractures, more extreme weather - including more intense heatwaves - can be expected.

The result is further acceleration of warming in the Arctic, due to direct sunlight, due to warm wind carried north as the jet stream changes, due to warm water from rivers flowing into the Arctic Ocean, due to soot from wildfires settling on the snow and ice, causing their further demise, etc.

The image below illustrates the impact of warm river water. Off the coast of Anadyr, in East Siberia, waters reached a temperature of 15.4°C (59.7°F) on July 5, 2015, a 9.2°C (16.6°F) anomaly.


The image below also shows the impact of warm water from rivers in Alaska. Major melting took place on St Lawrence Island, as evident by the low sea surface temperatures around the Island on July 2, 2015 (left panel), while by July 6, 2015, much of this colder water had mixed with the warmer water moving up the Bering Strait from the Pacific Ocean and with the warm river water from Siberia and Alaska.


The Naval Research Laboratory's 30-day animation below illustrates the dramatic fall in sea ice thickness.


The image below shows sea surface temperatures in the Arctic as at July 7, 2015.


With ocean heat at very high levels, the danger is that, as temperatures keep rising, further methane hydrates will get destabilized and further amounts of methane will be released in the Arctic. High methane levels have already been showing up for years over the Arctic Ocean, indicating that methane releases from the seafloor of the Arctic Ocean are already taking place.


Above image shows that, on July 6, 2015, high methane levels show up north of Greenland (yellow oval). This could be a result of the heavy melting that is taking place on Greenland, exposing methane hydrates contained in the ice there. Hydrate destabilization on Greenland is discussed as feedback#21 at Feedbacks in the Arctic. Loss of ice mass on Greenland has fallen dramatically over the years and looks set to get even worse, as illustrated by the image below.

Dramatic ice mass loss on Greenland looks set to get even worse. See also discussion at the Controversy page.
Over the next few months, waters in the Arctic Ocean can be expected to further warm up and sea ice to further decline, all making that the situation can only be expected to worsen.
The situation is dire and calls for comprehensive and effective action, as discussed at the Climate Plan.


Sea surface temperatures in the Arctic as at July 7, 2015. http://arctic-news.blogspot.com/2015/07/fracturing-of-the-jet-stream.html
Posted by Sam Carana on Wednesday, July 8, 2015

Thursday, June 25, 2015

Accelerated Warming in the Arctic


Warming in the Arctic is accelerating. On June 25, 2015, high temperatures hit North America. Temperatures as high as 30.3°C (86.54°F) were recorded where the Mackenzie River is flowing into the Arctic Ocean.

June 25, 2015 - High temperatures over North America, close to the Arctic Ocean

On July 1, 2015, temperatures are forecast to be as high as 111.4°F (or 44.1°C) near Chico, north of San Francisco. Temperatures are forecast to be high over most of North America and Eastern Siberia, threatening to further warm up waters of the Arctic Ocean.

Forecast for July 1, 2015 - High temperatures over North America, close to the Arctic Ocean

The image below shows that on June 27, 2015, temperatures of well over 40°C (104°F) were recorded in Europe and in Pakistan, where temperatures earlier this month had reached 49°C (120.2°F) in some places. The heat wave reportedly killed 1233 people in Karachi alone. This in addition to the 2500 people killed earlier in India by high temperatures.

June 27, 2015 - High temperatures over Russia, close to the Arctic Ocean
High temperatures at such locations are very worrying, for a number of reasons, including:
  • They are examples of heatwaves that can increasingly extend far to the north, all the way into the Arctic Ocean, speeding up warming of the Arctic Ocean seabed and threatening to unleash huge methane eruptions. 
  • They set the scene for wildfires that emit not only greenhouse gases such as carbon dioxide and methane, but also pollutants such as carbon monoxide (that depletes hydroxyl that could otherwise break down methane) and black carbon (that when settling on ice causes it to absorb more sunlight).
  • They cause warming of the water of rivers that end up in the Arctic Ocean, thus resulting in additional sea ice decline and warming of the Arctic Ocean seabed. 
June 24, 2015 - Smoke from wildfires in Alaska - from: wunderground.com
The image below shows increased sea surface temperature anomalies in the Arctic. Note the warming in the area of the Beaufort Sea where the Mackenzie River is flowing into the Arctic Ocean.


Very warm water is also flowing from the Pacific Ocean through the Bering Strait into the Arctic Ocean.  As the image below shows, the water that is flowing into the Arctic Ocean from the Pacific is much warmer than it used to be, as much as 6.1°C (10.98°F) warmer.

View the flow of the water on the animated version of above image at earth.nullschool.net
As said above, warm water flowing from rivers into the Arctic Ocean is a major contributor to these sea surface temperature anomalies. As also illustrated by the NOAA image below, rivers carrying warm water into the Bering Strait include the Kobuk River, the Naotak River and the Yukon River that flows all the way from British Columbia, Canada, through Alaska and ends in the Bering Strait. Sea surface temperatures near the coast of Alaska were as high as 19°C (66.2°F) from June 21-24, 2015.

Sea surface temperatures near the coast of Alaska as high as 19°C (66.2°F) from June 21-24, 2015
The Naval Research Laboratory animation below shows changes to Arctic sea ice thickness. Sea ice thickness (in m) down to zero where the Mackenzie River flows into the Arctic Ocean and in the Bering Strait where warm water from the Pacific is entering the Arctic Ocean.


The situation is dire and calls for comprehensive and effective action, as discussed at the Climate Plan.


Related

- Gulf Stream brings ever warmer water into Arctic Ocean
http://arctic-news.blogspot.com/2015/06/gulf-stream-brings-ever-warmer-water-into-arctic-ocean.html

- High Temperatures in the Arctic

- Heat Wave Forecast For Russia Early June 2015http://arctic-news.blogspot.com/2015/06/heat-wave-forecast-for-russia-early-june-2015.html

Sea surface temperature anomalies in the Arctic. Note the warming in the area of the Beaufort Sea where the Mackenzie...
Posted by Sam Carana on Thursday, June 25, 2015

Monday, June 1, 2015

Heat Wave Forecast For Russia Early June 2015


Following heat waves in Alaska and the north of Canada, the Arctic looks set to be hit by heat waves along the north coast of Russia in early June, 2015. The image below shows temperature anomalies at the top end of the scale for a large area of Russia forecast for June 6, 2015.


Meanwhile, the heat wave in India continues. It killed more than 2,100 people, reports Reuters, adding that the heat wave also killed more than 17 million chickens in May. The number of people killed by the heat wave is now approaching the 2,541 people killed by the 1998 heat wave in India, which is listed as the record number of deaths due to extreme temperatures in India by the Emergency Events Database.

Further records listed by the database are the well over 70,000 people killed by the 2003 heat wave in Europe and 55,736 people killed by the 2010 heat wave in Russia alone.

On above temperature forecast (left image, top right), temperatures over a large area of India will be approaching the top end of the scale, i.e. 50°C or 120°F. While such temperatures are not unusual in India around this time of year, the length of the heat wave is extraordinary. The heat wave that is about to hit Russia comes with even higher temperature anomalies. Even though temperatures in Russia are unlikely to reach the peaks that hit India, the anomalies are at the top end of the scale, i.e. 20°C or 36°F.

The image below shows a forecast for June 6, 2015, with high temperatures highlighted at four locations (green circles).


Below is a forecast for the jet stream as at June 7, 2015.

The animation below runs the time of the top image (June 6, 2015, 0900 UTC) to the above image (June 7, 2015, 1200 UTC), showing forecasts of the jet stream moving over the Arctic Ocean, with its meandering shape holding warm air that extends from Russia deep into the Arctic Ocean.


Below is another view of the situation.
Jet stream on June 6, 2015, 0900 UTC, i.e. the date and time that corresponds with the top image.
Clicking on this link will bring you to an animated version that also shows the wind direction, highlighting the speed (I clocked winds of up to 148 km/h, or 92 mph) of the jet stream as it moves warm air from Russia into the Arctic Ocean, sped up by cyclonic wind around Svalbard.

This is the 'open doors' feedback at work, i.e. feedback #4 on the feedbacks page, where accelerated warming in the Arctic causes the jet stream to meander more, which allows warm air to enter the Arctic more easily, in a self-reinforcing spiral that further accelerates warming in the Arctic.

The implications of temperatures that are so much higher than they used to be are huge for the Arctic. These high temperatures are heating up the sea ice from above, while rivers further feed warm water into the Arctic Ocean, heating up the sea ice from below.

Furthermore, such high temperatures set the scene for wildfires that can emit huge amounts of pollutants, among which dust and black carbon that, when settling on the sea ice, can cause large albedo falls.

The image below shows Russian rivers that end up in the Arctic Ocean, while the image also shows sea surface temperature anomalies as high as 8.2°C or 14.76°F (at the green circle, near Svalbard).


The big danger is that the combined impact of these feedbacks will accelerate warming in the Arctic to a point where huge amounts of methane will erupt abruptly from the seafloor of the Arctic Ocean.
The image below shows that methane levels as high as 2,566 ppb were recorded on May 31, 2015, while high methane levels are visible over the East Siberian Arctic Shelf.


Below is part of a comment on the situation by Albert Kallio:
As the soils warm up the bacteria in them and the insulating capacities of snow themselves tend to lead snow cover melting faster the warmer the soil it rests on becomes. (Thus the falling snow melts very rapidly on British soil surface if compared to Finland or Siberia where the underlying ground is much colder, even if occasionally the summers have similar or even higher temperatures).

The large snow cover over the mid latitude land masses is a strong negative feedback for the heat intake from the sun if the season 2015 is compared with the season 2012, but the massive sea ice and polar air mass out-transportation equally strongly weakens formation of new sea ice around the North Pole (and along the edges of the Arctic Ocean) as the air above the Arctic Ocean remains warm. The pile up of thin coastal ice also increases vertical upturning of sea water and this could have detrimental effects for the frozen seabed that is storing methane clathrates. The sunlight intake of the sea areas where sea ice has already disappeared corresponds largely with the 2012 season.

The inevitable snow melting around the Arctic Ocean will also transport record volumes of warmed melt water from the south to the Arctic Ocean. The available heat in the Arctic may also be later enhanced by the high sea water temperatures that prevail along the eastern and western coasts of North America, as well as El Nino event increasing temporarily air and sea surface temperatures. This leads to more depressions around Japan and Korea from where the warm air, storms and rains migrate towards Alaska and pull cold air away from Arctic over Russia, while pushing warm air through the Baring Strait area and Alaska to the Arctic Ocean region.

Forecasting seasonal out comes is likely to be increasingly difficult to make due to increasing number of variables in the seasonal melting processes and the resulting lack of historic precedents when the oceans and Arctic has been as warm as today. Thus the interplay of the opposing forces makes increasingly chaotic outcomes, in which the overall trend will always be for less ice and snow at the end of the season. Because of these reasons - including many others not explicitly mentioned here - the overall outcome for the blue ocean, or the ice-free Arctic Ocean, will be inevitable.

Whether the loss of sea ice happens this summer, or next, or one after that, the problem isn't going to go away and more needs to be done to geoengineer to save Arctic ice and wildlife dependent on summer sea ice.
John Davies responds:
Albert Kallio is absolutely right in saying that warmer temperatures are leading to a blue ocean event though the problem remains in which year this will happen. Additionally Methane is being released from the bottom of the ocean leading to increased Methane concentrations and all that means for a destabilising global climate. Frustratingly, the higher temperatures and increasing Methane concentrations are not yet quite sufficient for us to persuade the scientific community and the public that Armageddon is on the way. Hence it is not yet possible to be in a position to persuade the world community of the urgent need for Geo-engineering to save the Arctic and Global climate. However we may reach this situation in the near future and that will be the only time when it might be possible to save the global climate and prevent Armageddon.

The situation is dire and calls for comprehensive and effective action, as discussed at the Climate Plan page.


This image shows Russian rivers that end up in the Arctic Ocean, while it also shows sea surface temperature anomalies...
Posted by Sam Carana on Monday, June 1, 2015

Sunday, May 31, 2015

Arctic Methane Skyrocketing

The map below shows observatories in the Arctic.


    'Arctic methane skyrocketing' is the title of a video by Paul Beckwith discussing recent rises in methane levels in the Arctic.


    Paul's description: "I discuss how ground level flask measurements of methane have been spiking upwards over the last few years. I analyze the implications to the breakdown of climate stability, causing jet stream fracturing and weather regime change. I believe that this behaviour will rapidly worsen as Arctic temperature amplification continues, leading our planet to a much warmer and unrecognizable climate over the next 5 to 10 years."

    Below are some NOAA images showing methane levels (surface flasks) recorded at Arctic observatories.


    Below is an image showing hourly average in situ measurements at Barrow, Alaska, including one very high reading, from an earlier post.


    The image below shows sea surface temperature anomalies in the Arctic on May 30, 2015.


    The situation is dire and calls for comprehensive and effective action, as discussed at the Climate Plan page.


    Sea surface temperature anomalies in the Arctic on May 30, 2015. From the post: 'Arctic Methane Skyrocketing' http://arctic-news.blogspot.com/2015/05/arctic-methane-skyrocketing.html

    Posted by Sam Carana on Sunday, May 31, 2015

    Thursday, May 28, 2015

    Arctic Sea Ice in Uncharted Territory

    On May 27, 2015, Arctic sea ice extent was merely 11.973 million square kilometers, a record low for the time of the year since satellite started measurements in 1979.


    This fall in sea ice extent follows heat waves in Alaska and the north of Canada, as illustrated by the image below.

    Temperature in Alaska on the afternoon of May 23, 2015, when a temperature of 91°F (32.78°C) was recorded in Eagle
    High temperatures extended over the Beaufort Sea and Chukchi Sea. The image below shows the difference in sea surface temperatures between May 13, 2015, and May 23, 2015.


    The large amounts of meltwater flowing into Beaufort Sea and the Chukchi Sea is illustrated by the image below, showing the difference in sea surface salinity between May 17, 2015, and May 24, 2015.


    Sea ice has retreated dramatically in the Chukchi Sea and the Beaufort Sea, and in Baffin Bay, with high sea surface temperature showing up where rivers flow into the Arctic Ocean and where the Gulf Stream carries warm water from the Atlantic Ocean into the Arctic Ocean.

    The size-reduced navy.mil animations below show the fall in sea surface salinity (left) and the fall in sea ice thickness (right) in the Beaufort Sea, from May 3, 2015, to June 2, 2015 (run May 27, 2015).

    Sea surface salinity Beaufort Sea
    Sea ice thickness Beaufort Sea
       
    The image below shows sea surface temperature anomalies on May 27, 2015.


    For reference, the animation below, from the Naval Research Laboratory, shows sea ice thickness over a 30-day period, including a forecast up to June 4, 2015.


    Update: here's an image showing Arctic sea ice extent up to May 28, 2015, highlighting that sea ice extent is now well outside 2 standard deviations.


    The situation is dire and calls for comprehensive and effective action as discussed at the Climate Plan.


    Arctic Sea Ice in Uncharted Territory Sea ice has retreated dramatically in the Chukchi Sea and the Beaufort Sea, and...
    Posted by Sam Carana on Thursday, May 28, 2015