Showing posts with label Peter Wadhams. Show all posts

Friday, July 15, 2016

A Global Temperature Rise Of More than Ten Degrees Celsius By 2026?

How much have temperatures risen and how much additional warming could eventuate over the next decade? The image on the right shows a potential global temperature rise by 2026 from pre-industrial levels. This rise contains a number of elements, as discussed below from the top down.

February 2016 rise from 1900 (1.62°C)

The magenta element at the top reflects the temperature rise since 1900. In February 2016, it was 1.62°C warmer compared to the year 1900, so that's a rise that has already manifested itself.

Rise from pre-industrial levels to 1900 (0.3°C)

Additional warming was caused by humans before 1900. Accordingly, the next (light blue) element from the top down uses 0.3°C warming to reflect anthropogenic warming from pre-industrial levels to the year 1900.

When also taking this warming into account, then it was 1.92°C (3.46°F) warmer in February 2016 than in pre-industrial times, as is also illustrated on the image below.


Warming from the other elements (described below) comes on top of the warming that was already achieved in February 2016.

Rise due to carbon dioxide from 2016 to 2026 (0.5°C)

The purple element reflects warming due to the amount of carbon dioxide in the atmosphere by 2026. While the IEA reported that energy-related carbon dioxide emissions had not risen over the past few years, carbon dioxide levels in the atmosphere have continued to rise, due to feedbacks that are kicking in, such as wildfires and reduced carbon sinks. Furthermore, maximum warming occurs about one decade after a carbon dioxide emission, so the full warming wrath of the carbon dioxide emissions over the past ten years is still to come. In conclusion, an extra 0.5°C warming by 2026 seems possible as long as carbon dioxide levels in the atmosphere and oceans remain high and as temperatures keep rising.

Removal of aerosols masking effect (2.5°C)

With dramatic cuts in emissions, there will also be a dramatic fall in aerosols that currently mask the full warming of greenhouse gases. From 1850 to 2010, anthropogenic aerosols brought about a decrease of ∼2.53 K, says a recent paper. While on the one hand not all of the aerosols masking effect may be removed over the next ten years, there now are a lot more aerosols than in 2010. A 2.5°C warming due to removal of part of the aerosols masking effect therefore seems well possible by the year 2026.

Albedo changes in the Arctic (1.6°C) 

Warming due to Arctic snow and ice loss may well exceed 2 W per square meter, i.e. it could more than double the net warming now caused by all emissions by people of the world, calculated Professor Peter Wadhams in 2012. A 1.6°C warming due to albedo changes (i.e. decline of both Arctic sea ice and snow and ice cover on land) therefore seems well possible by the year 2026.

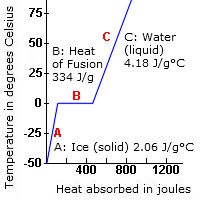
Methane eruptions from the seafloor (1.1°C)

". . we consider release of up to 50 Gt of predicted amount of hydrate storage as highly possible for abrupt release at any time," Dr. Natalia Shakhova et al. wrote in a paper presented at EGU General Assembly 2008. Authors found that such a release would cause 1.3°C warming by 2100. Note that such warming from an extra 50 Gt of methane seems conservative when considering that there now is only some 5 Gt of methane in the atmosphere, and over a period of ten years this 5 Gt is already responsible for more warming than all the carbon dioxide emitted by people since the start of the industrial revolution. Professor Peter Wadhams co-authored a study that calculated that methane release from the seafloor of the Arctic Ocean could yield 0.6°C warming of the planet in 5 years (see video at earlier post). In conclusion, as temperatures keep rising, a 1.1°C warming due to methane releases from clathrates at the seafloor of the world's oceans seems well possible by the year 2026.

Extra water vapor feedback (2.1°C)

Rising temperatures will result in more water vapor in the atmosphere (7% more water vapor for every 1°C warming), further amplifying warming, since water vapor is a potent greenhouse gas. Extra water vapor will result from warming due to the above-mentioned albedo changes in the Arctic and methane releases from the seafloor that could strike within years and could result in huge warming in addition to the warming that is already there now. As the IPCC says: "Water vapour feedback acting alone approximately doubles the warming from what it would be for fixed water vapour. Furthermore, water vapour feedback acts to amplify other feedbacks in models, such as cloud feedback and ice albedo feedback. If cloud feedback is strongly positive, the water vapour feedback can lead to 3.5 times as much warming as would be the case if water vapour concentration were held fixed", according to the IPCC. Given a possible additional warming of 2.7°C due to just two elements, i.e. Arctic albedo changes and seafloor methane, an additional warming over the next decade of 2.1°C due to extra water vapor in the atmosphere therefore does seem well possible by the year 2026.

Further feedbacks (0.3°C)

Further feedbacks will result from interactions between the above elements. Additional water vapor in the atmosphere and extra energy trapped in the atmosphere will result in more intense storms and precipitation, flooding and lightning. Flooding can cause rapid decomposition of vegetation, resulting in strong methane releases. Furthermore, plumes above the anvils of severe storms can bring water vapor up into the stratosphere, contributing to the formation of cirrus clouds that trap a lot of heat that would otherwise be radiated away, from Earth into space. The number of lightning strikes can be expected to increase by about 12% for every 1°C of rise in global average air temperature. At 3-8 miles height, during the summer months, lightning activity increases NOx by as much as 90% and ozone by more than 30%. The combination of higher temperatures and more lightning will also cause more wildfires, resulting in emissions such as of methane and carbon monoxide. Ozone acts as a direct greenhouse gas, while ozone and carbon monoxide can both act to extend the lifetime of methane. Such feedbacks may well result in an additional 0.3°C warming by the year 2026.

Total potential global temperature rise by 2026 (10°C or 18°F)

Adding up all the warming associated with the above elements results in a total potential global temperature rise (land and ocean) of more than than 10°C or 18°F within a decade, i.e. by 2026. As said before, this scenario assumes that no geoengineering will take place over the next decade.

The situation is dire and calls for comprehensive and effective action as described in the Climate Plan.


Sunday, July 10, 2016

Extreme Weather Events


Sea ice close to the North Pole looks slushy and fractured into small pieces. The image below shows the situation on July 8, 2016.

Sea ice north of the geographic North Pole. For more on the (geo)magnetic North Pole, see this page
For reference, the bars at the bottom right show distances of 20 km and 20 miles. By comparison, sea ice in the same area did develop large cracks in 2012, but even in September 13, 2012, it was not broken up into small pieces, as shown by this image at a recent post.


As shown by above image, by Jim Pettit, Arctic sea ice volume has been in decline for decades. While this may look like a steady decline, chances are that the sea ice will abruptly collapse over the next two months, for the reasons described below.

The animation below, from the Naval Research Laboratory, shows Arctic sea ice thickness for 30 days up through July 8, 2016, including a forecast of 7 days.

Below is a new Naval Research Laboratory image, dated July 4, 2016
and contributed by Albert Kallio with the following description.


NORTH POLE SEA ICE DISAPPEARING VERY RAPIDLY 4.7.2016

Albert Kallio: The upgraded US Navy sea ice thickness system revealed extreme rates of sea ice pulverization and melting on 4.7.2016 which justifies a continued close attention to the developments on the Arctic Ocean. Due to virtually continuous storm centering the North Pole for weeks now, warm water upswells and sea water mixing drives base melting of icefloes besides wave actions that both wash and pulverize broken sea ice. The more pulverized sea ice becomes, the greater its 3-dimensional surface area that sits in water becomes, this easing transfer of heat from ocean to sea ice. In addition, honeycombing of ice also flushes ice with water in a stormy weather. The final factor being that most of sea ice is very recent (seasonal) ice that contain residues of salts, when saline brine is expelled this creates boreholes into ice making it "rotten ice" easily.
https://www7320.nrlssc.navy.mil/GLBhycomcice-12/navo/arcticictn_nowcast_anim30d.gif
Sea ice decline reflects the extra energy added to the Arctic, as global warming and feedbacks are hitting the Arctic particularly strongly. Three of these feedbacks are depicted in the image on the right.

As the sea ice melts, sea surface temperatures will remain at around zero degree Celsius (32°F) for as long as there is ice in the water, since the extra energy will first go into melting the ice. Only after the ice has melted will the extra energy start raising the temperature of the water.

Sea ice thus acts as a buffer that absorbs heat, preventing sea surface temperature from rising. As
sea ice is busy melting, each gram of ice takes 334 Joule of heat to change into water, while the temperature remains steady at 0°C ( 32°F).

Once all ice has turned into water, all further heat goes into raising the temperature of the water. To raise the temperature of each gram of water by one degree Celsius then takes only 4.18 Joule of heat.

In other words, melting of the ice absorbs 8 times as much heat as it takes to warm up the same mass of water from zero to 10°C. As sea ice disappears, extra energy instead goes into raising the temperature of the water, as depicted in the image on the right, and as further described at the feedbacks page as feedback #14.

Sea ice can reflect as much as 90% of the sunlight back into space. Once the ice has melted away, the water of the ocean reflects only 6% of the incoming solar radiation and absorbs the rest. Albedo change is depicted in above image as feedback #1. As Professor Peter Wadhams once calculated, warming due to Arctic snow and ice loss could more than double the net warming now caused by all emissions by all people of the world.

Professor Peter Wadhams on albedo changes in the Arctic, image from Edge of Extinction
Once the sea ice has disappeared, a lot more energy will get absorbed by the Arctic Ocean, i.e. energy that was previously reflected back into space and energy that previously went into changing ice into water.

Furthermore, as the sea ice disappears, chances increase that storms will develop that come with rain and winds that can batter and push the remaining sea ice out of the Arctic Ocean, while storms can also increase the amount of water vapor in the atmosphere and the occurrence of cirrus clouds that can trap heat.

Methane is a further feedback, depicted as feedback #2 in the image further above. As the water of the Arctic Ocean gets warmer, the danger increases that heat will reach hydrates at the seafloor and that this will trigger release of huge amounts of methane, in an additional self-reinforcing feedback loop that will make warming in the Arctic accelerate further and that threatens to escalate into a third kind of warming, i.e. runaway warming. Peter Wadhams co-authored a study that calculated that methane release from the seafloor of the Arctic Ocean could yield 0.6°C warming of the planet in 5 years (see video at earlier post).


As above image shows, methane on July 8, 2016, reached levels as high as 2655 ppb. Such high levels typically occur due to methane hydrates getting destabilized. As the sea ice disappears, the situation could get worse rapidly, as illustrated by the images below.

July 5, 2016, sea surface was as warm as 17.1°C / 62.7°F at green circle, i.e. 13.7°C / 24.7°F warmer than 1981-2011. 
These high sea surface temperature anomalies are the result of warmer water getting carried by the Gulf Stream below the sea surface of the Atlantic Ocean into the Arctic Ocean. The water carried into the Arctic Ocean is both warmer and saltier than the water at the surface, as the fresh cold meltwater forms a lid at the surface. At areas around Svalbard where the sea is rather shallow, the warmer water comes to the surface. These high anomalies thus indicate how much warmer the water now is that is entering the Arctic Ocean, as discussed in earlier posts such as this one.
image from previous post
The rapid recent rise in ocean heat is illustrated by above image, showing that oceans on the Northern Hemisphere in May 2015 through April 2016 were 0.93°C warmer than the 20th century average, whereas for the equivalent 2012 period the anomaly was merely 0.46°C. In other words, there now is more ocean heat, making the possibility of methane hydrates destabilization more threatening.

Meanwhile, the speed at which the Arctic is warming is changing the jet streams, as discussed by Paul Beckwith in the video below, following Paul's earlier video that's included in an earlier post.


There are many indications that changes to the climate are accelerating, causing extreme weather events to hit with increasing strength and intensity. Water vapor is a potent greenhouse gas and for each degree Celsius that temperatures rise, the atmosphere can hold 7% more water vapor, which will also lead to stronger storms such as cyclones. On the image below, typhoon Nepartak is approaching Taiwan, with wind speed as high as 103 mph or 165 km/h, and with cloud water as much as 9 kg per square m on July 7, 2016.

Nepartak approaching Taiwan on July 7, 2016, with wind speed as high as 103 mph or 165 km/h (left panel), and with cloud water as much as 9 kg per square m (right panel)
NASA image
According to NASA, very powerful storms near the center of Nepartak's circulation were found to be dropping rain at a rate of over 193 mm (7.6 inches) per hour. Tall thunderstorms called "hot towers" were found to reach heights of 17.0 km (about 10.5 miles).

The image on the right shows a thermal image of Typhoon Nepartak on July 7 at 17:45 UTC. The colder the cloud tops, the higher they are in the troposphere and the stronger the storms.

On July 7, 2016, at 1500 UTC, Nepartak's maximum sustained winds had reached 150 knots (172.6 mph/ 277.8 kph), generating waves as high as 48 feet (14.6 meters).

Strong storms can bring water vapor high up into the stratosphere, contributing to the formation of cirrus clouds that trap a lot of heat that would otherwise be radiated away, from Earth into space.

Altogether, the combined global temperature rise due to global warming and feedbacks could exceed 10°C or 18°F within a decade, as discussed in previous posts such as this one.

The situation is dire and calls for comprehensive and effective action as described in the Climate Plan.


Links

 The North Geographic Pole, the North Magnetic Pole and the North Geomagnetic Pole
http://wdc.kugi.kyoto-u.ac.jp/poles/polesexp.html

 Three Kinds of Warming in the Arctic
http://arctic-news.blogspot.com/2016/02/three-kinds-of-warming-in-arctic.html

 NASA: Napartak (July 9, 2016)
https://www.nasa.gov/feature/goddard/2016/napartak-nw-pacific-ocean

 Jim Pettit Climate Graphs
http://iwantsomeproof.com/3d/siv-ds-weekly-3d.asp


Sunday, June 5, 2016

High Temperatures In Arctic

0-2000 m Global Ocean Heat Content
Ocean heat content is rising, as illustrated by the image on the right. Where the sea ice declines, this is causing high air temperatures in the Arctic.

This year (from January to April 2016) on the Northern Hemisphere, oceans were 0.85°C or 1.53°F warmer than the 20th century average.

The image below illustrates that temperatures look set to be high in Siberia for the coming week. The panel on the right shows anomalies at the top end of the scale in Eastern Siberia on June 5, 2016, while the panel on the right shows a forecast for June 12, 2016.


These high air temperatures are causing feedbacks that are in turn further speeding up warming in the Arctic.

Warmer Rivers

Temperatures as high as 28.9°C or 83.9°F were recorded over the Mackenzie River close to the Arctic Ocean on June 13, 2016, at location marked by the green circle.


Below is a satellite image of the Mackenzie River delta on June 11, 2016


The image below shows that temperatures as high as 36.6°C or 97.8°F were forecast for June 13, 2016, over the Yenisei River in Siberia that ends in the Arctic Ocean.


Wildfires

Earlier this month, temperatures in Eastern Siberia were as high as 29.5°C (85°F). This was on June 5, 2016, at a location close to the coast of the Arctic Ocean (green circle).


High air temperatures come with increased risk of wildfires, as illustrated by the image below showing carbon monoxide levels as high as 2944 ppb on June 4, 2016 (at green circle).


The satellite image below zooms into the area with these high carbon monoxide readings, showing wildfires on Kamchatka Peninsula on June 3, 2016.


Albedo Loss

The image on the right shows that, this year, April snow cover on the Northern Hemisphere was the lowest on record. The added trend points at a total absence of snow by the year 2036.

Professor Peter Wadhams, head of the Polar Ocean Physics Group at Cambridge University, says: “My prediction remains that the Arctic ice may well disappear, that is, have an area of less than one million square kilometres for September of this year.”

Warming due to Arctic snow and ice loss may well exceed 2 W per square meter, i.e. it could more than double the net warming now caused by all emissions by people of the world, Peter Wadhams calculated in 2012.

Seafloor Methane

Peter Wadhams further co-authored a study that calculated that methane release from the seafloor of the Arctic Ocean could yield 0.6°C warming of the planet in 5 years (see video interview of Thom Hartmann with Peter Wadhams below).


Combined Impact Of Multiple Feebacks

In conclusion, high air temperatures in the Arctic are very worrying, as they can trigger a number of important feedbacks, i.e. the ones discussed above and further feedbacks such as:
  • Changes to Jet Streams. As the Arctic warms more rapidly than the rest of Earth, changes are occurring to the jet streams. As a result, winds can increasingly bring hot air far to the north, resulting in further loss of the Arctic snow and ice cover, in turn further warming up the Arctic.
  • Warmer Rivers. High air temperatures cause warming of the water of rivers that end up in the Arctic Ocean, thus resulting in additional sea ice decline and warming of the Arctic Ocean all the way down to the seabed.
  • Wildfires. High air temperatures set the scene for wildfires that emit not only greenhouse gases such as carbon dioxide and methane, but also pollutants such as carbon monoxide that depletes hydroxyl that could otherwise break down methane, and black carbon that, when settling on ice, causes it to absorb more sunlight (see under albedo loss), besides being a climate forcer when in the atmosphere.
  • Soil destabilization. Heatwaves and droughts destabilize the soil. Soil that was previously known as permafrost, was until now held together by ice. As the ice melts, organic material in the soil starts decomposing, resulting in emissions of methane and carbon dioxide, while the soil becomes increasingly vulnerable to wildfires.
  • Buffer Loss. Arctic snow and ice cover acts as a buffer, absorbing heat that in the absence of this buffer will have to be absorbed by the Arctic Ocean, as discussed in earlier posts such as this one
  • Albedo Loss. Arctic snow and ice cover make that sunlight is reflected back into space. In the absence of this cover, the Arctic will have to absorb more heat.
  • Seafloor Methane. As sediments at the seafloor of the Arctic Ocean warm, hydrates contained in these sediments could be destabilized and release huge quantities of methane.

How much warmer could it be within one decade?

The two feedbacks mentioned by Peter Wadham (albedo and seafloor methane) are are depicted in the image below.

for further discussion, see the feedbacks page
The combined global temperature rise over the next decade due to these two feedbacks (albedo and seafloor methane) alone may be 0.4°C or 0.72°F for a low-rise scenario and may be 2.7°C or 4.9°F for a high-rise scenario.

Additionally, as temperatures rise, further feedbacks will kick in more strongly, further accelerating the rise in temperature, as also discussed in earlier posts such as this one.

When also including further feedbacks, warming could exceed 10°C (18°F) within one decade, assuming that no geoengineering will take place within a decade, as discussed in earlier posts such as this one.

The situation is dire and calls for comprehensive and effective action, as described at the Climate Plan.

Links

• Climate Plan
http://arctic-news.blogspot.com/p/climateplan.html

• Feedbacks in the Arctic
http://arctic-news.blogspot.com/p/feedbacks.html

• East Siberian Heatwave
http://arctic-news.blogspot.com/2015/07/east-siberian-heat-wave.html

• Wildfire Danger Increasing
http://arctic-news.blogspot.com/2016/05/wildfire-danger-increasing.html

• Albedo changes in the Arctic
http://arctic-news.blogspot.com/2012/07/albedo-change-in-arctic.html

• Three kinds of warming in the Arctic
http://arctic-news.blogspot.com/2016/02/three-kinds-of-warming-in-arctic.html

• Arctic could become ice-free for first time in more than 100,000 years, claims leading scientist
http://www.independent.co.uk/environment/climate-change/arctic-could-become-ice-free-for-first-time-in-more-than-100000-years-claims-leading-scientist-a7065781.html

• Greenhouse gas levels and temperatures keep rising
http://arctic-news.blogspot.com/2016/01/greenhouse-gas-levels-and-temperatures-keep-rising.html

• Arctic Methane Release: "Economic Time Bomb"
http://arctic-news.blogspot.com/2013/07/arctic-methane-release-economic-time-bomb.html

• February Temperature
http://arctic-news.blogspot.com/2016/03/february-temperature.html

• September 2015 Sea Surface Warmest On Record

Saturday, February 28, 2015

The Mechanism

What is the mechanism behind accelerated warming of the Arctic Ocean, huge abrupt methane eruptions from the seafloor of the Arctic Ocean and skyrocketing temperatures?


1. Potential for Methane Release in Arctic

Vast amounts of methane are stored in hydrates under the seafloor of the Arctic Ocean. Furthermore, vast amounts of methane in the form of free gas are contained in sediments under the seafloor of the Arctic Ocean. Thirdly, vast amounts of carbon are frozen in the permafrost and much may enter the atmosphere in the form of methane as the permafrost continues to thaw.

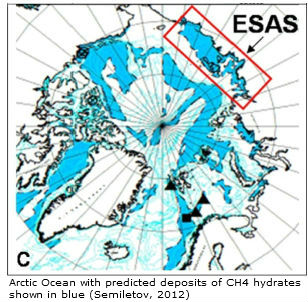
Natalia Shakhova et al. in 2010 estimated the accumulated potential for the East Siberian Arctic Shelf (ESAS) region alone (image on the right) as follows:
- organic carbon in permafrost of about 500 Gt
- about 1000 Gt in hydrate deposits
- about 700 Gt in free gas beneath the gas hydrate stability zone.

In early 2014, Sam Carana estimated annual methane emissions from hydrates and permafrost at 100 Tg (i.e. 0.1 Gt). This methane will contribute to further warming of the air over the Arctic and the North Atlantic, causing further extreme weather events, such as heatwaves and storms along the path of the Gulf Stream from the North Atlantic into the Arctic Ocean, in turn triggering further releases from hydrates at the seafloor of the Arctic Ocean and threatening to escalate into runaway global warming.


Such methane eruptions are caused by warming water of the Arctic Ocean, which in turn is due to emissions by people. Some elements of the mechanism causing methane to erupt from the seafloor are described in more detail below.

2. Ocean Heat
From: Ocean Temperature Rise continues
Above graph, based on NOAA data, shows a polynomial trendline pointing at an October Northern Hemisphere sea surface temperature anomaly rise of more than 5°C (9°F) by 2050, compared to the 20th century average, from an earlier post.

Waters at greater depth are also warming rapidly, as illustrated by the image on the right, from an earlier post, showing a rise in ocean heat up to 2000 m deep that has more than doubled over the past decade. Data from 2005 through to 2014 contain a polynomial trendline that points at a similar rise by 2017, followed by an even steeper rise.

The North Atlantic is warming rapidly, with sea surface temperature anomalies as high as a 12°C (21.6°F) recorded east of North America earlier this year, as illustrated by the image below.

A warmer North Atlantic is a major contributor to the rapidly warming waters of the Arctic Ocean, since the Gulf Stream keeps carrying warmer water into the Arctic Ocean all year long.

A further contributor is a warmer North Pacific.

Further contributions come from the combined impact of numerous feedbacks, in particular changing winds and currents, cryosphere changes and methane releases, as further described below.

From: Watch where the wind blows

3. Feedbacks: Changing Winds and Currents, Cryosphere Changes and Methane

- Changed Winds and Currents

Emissions by people are not only causing temperatures of the atmosphere and oceans to rise, they are also causing winds and ocean currents to change. Such changes can in turn result in heatwaves that are more intense and that persist for prolonged periods. Furthermore, strong northbound winds, combined with strong precipitation and waves can speed up the volume of warm water carried by Gulf Stream into the Arctic Ocean, as discussed in an earlier post

- Arctic Sea Ice

A warming atmosphere, warming oceans and decline of the Arctic snow and ice cover all go hand in hand. The IPCC concluded in AR5 that, for RCP8.5, the Arctic Ocean will likely be nearly ice-free in September before mid-century. Prof. Peter Wadhams warned, back in 2012, that the Arctic Ocean could be virtually ice-free within a few years. An exponential trendline based on sea ice volume observations shows that sea ice looks set to disappear in 2019, while disappearance in 2015 is within the margins of a 5% confidence interval, reflecting natural variability, as discussed at the FAQ page.


- Permafrost

Permafrost decline will cause Arctic temperatures to rise, due to albedo change and due to carbon that is contained in the permafrost and that can be expected to be released in the form of methane or carbon dioxide as the permafrost thaws. The image below pictures permafrost decline as foreseen by the IPCC in AR5. 


Obviously, rapid decline of the sea ice will come with albedo changes that will also make the permafrost decline more strongly than the IPCC foresees, while they will also cause even more extreme weather events. One of the dangers is that huge amounts of warmer water will flow from rivers into the Arctic Ocean, as discussed below.

- Warmer Water From Rivers

More sunlight getting absorbed in the Arctic will accelerate warming of the Arctic Ocean directly, while there will also be warmer water flowing into the Arctic Ocean from rivers in Siberia and North America, fueled by stronger and longer heatwaves, storms and wildfires. 

map from: http://en.wikipedia.org/wiki/File:Rs-map.png
Above map shows that a number of large rivers in Siberia end up in the Arctic Ocean. Another large river is the Mackenzie River, which ends in the Beaufort Sea, north of Alaska, where sea surface temperatures of about 20°C (68°F) were recorded in 2013, as the image below illustrates.


Another area of concern, also marked with a purple oval in the image below, is located in the north of Canada.


More extreme weather events include heat waves, storms, floods and wildfires, all of which can contribute to more rapid warming of the Arctic Ocean.

The combined effect of all the above will be that methane that is now contained in the form of free gas and hydrates in sediments under the Arctic Ocean, can be expected to be increasingly released as the Arctic Ocean warms further.

- Methane 

Of the vast amounts of methane stored in the Arctic, much of it is prone to be released with further temperature rises, as discussed in this earlier post and in this earlier post. Cracks in sediments used to be filled with ice. Warmer water is now melting the ice that used to sit in cracks. This ice has until now acted as a glue, holding the sediment together. Moreover, the ice in the cracks has until now acted as a barrier, a seal, that prevented the methane contained in those sediments from escaping. In a video interview with Nick Breeze, Natalia Shakhova mentions a sample of sediment taken from the ESAS seafloor in 2011 that turned out to be ice-free to a depth of 53 m at water temperatures varying from -0.6˚C to -1.3˚C. Back in 2008, Natalia Shakhova et al. considered release of up to 50 Gt of predicted amount of hydrate storage as highly possible for abrupt release at any time.

The image below, based on data from the IPCC and the World Metereological Organization (WMO), with an added observation from a NOAA MetOp satellite image, illustrates the recent rise of methane levels and the threat that methane levels will continue to rise rapidly.


When looked at from a longer range of years, above image fits in the black square on the image below.


The image below shows exponential rise based on data of East Siberian Arctic Shelf (ESAS) releases alone, as discussed in an earlier post.


Non-linear rise is supported by the fact that methane's lifetime increases as more methane enters the atmosphere. As the image below shows, peak methane levels have been very high recently.


All these feedbacks can interact and amplify each other in non-linear ways, resulting in rapid and intense temperature rises, as illustrated by the image below.

Diagram of Doom - for more background, see Feedbacks

4. Runaway Global Warming

The threat is that such rapid temperature rises will appear at first in hotspots over the Arctic and eventually around the globe, while also resulting in huge temperature swings that could result in depletion of supply of food and fresh water, as further illustrated by the above image, from an earlier post, and the image below, from another earlier post.

Rapidly rising temperatures will cause stronger evaporation of sea water. Since water vapor is one of the strongest greenhouse gases, this can further contribute to the non-linear temperature rises pictured above.

In conclusion, the situation is dire and calls for comprehensive and effective action, as discussed at the Climate Plan blog.