Friday, January 17, 2020

Could Humans Go Extinct Within Years?


Above image depicts how humans could go extinct within years. The image was created with NASA LOTI 1880-Dec.2019 data, 0.78°C adjusted to reflect ocean air temperatures (as opposed to sea surface temperatures), to reflect higher polar temperature anomalies (as opposed to leaving out 'missing' data) and to reflect a 1750 baseline (as opposed to a 1951-1980 baseline), with two trends added. Blue: a long-term trend based on Jan.1880-Dec.2019 data. Red: a short-term trend, based on Jan.2009-Dec.2019 data, to illustrate El Niño/La Niña variability and how El Niño could be the catalyst to trigger huge methane releases from the Arctic Ocean. This updates an earlier post with more detail on how the image was created.

The image below shows El Niño/La Niña variability going back to 1950, added to the NOAA monthly temperature anomaly.
[ click on images to enlarge ]

The image on the right shows how ocean heat has increased over the years (from: from the paper Record-Setting Ocean Warmth Continued in 2019, by Lijing Chang et al.).

Ocean heat is increasing rapidly, especially on the Northern Hemisphere, as illustrated by the NOAA image below, showing the rise from 1980 through 2019.

The image underneath uses the same data and has a trend added pointing at a 1.5°C anomaly from the 20th century average by the year 2026.

As discussed in an earlier point, there is a tipping point at 1°C above the 20th century average, i.e. there are indications that a rise of 1°C will result in most of the sea ice underneath the surface to disappear. This sea ice used to consume the inflow of warm, salty water from the Atlantic Ocean and the Pacific Ocean. So, while there may still be sea ice left at the surface, the latent heat buffer will be gone.
[ click on images to enlarge ]
Loss of the latent heat buffer speeds up heating of the Arctic Ocean, with the danger that huge amounts of methane will be released from the seafloor. The image below illustrates the danger, showing that peak methane levels as high as 2670 parts per billion (ppb) were recorded by the MetOp-1 satellite on January 2, 2020 pm at 469 mb.


Most worryingly, above image shows a large almost-solidly magenta-colored area blanketing the East Siberian Arctic Shelf (ESAS), with magenta indicating levels above 1950 ppb. Such satellite measurements indicate that large amounts of methane are erupting from the seafloor of the Arctic Ocean.


Above image shows that, a few years ago, methane was accumulating most strongly at an altitude corresponding to a pressure of some 400 mb. More recently, methane has been accumulating most strongly at higher altitudes, corresponding to a pressure of just under 300 mb, which is the upper limit of the troposphere over the North Pole. Methane tends to follow the Tropopause, i.e. at higher altitudes methane will be present in higher concentrations closer to the Equator, where the troposphere extends further into space, as discussed in an earlier post.

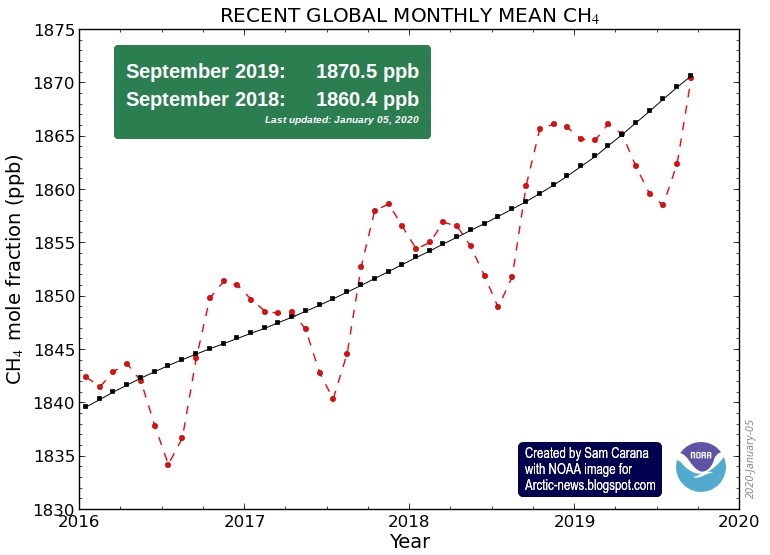
The NOAA graph below indicates that methane levels are growing at over 10 parts per billion per year, and this may actually underestimate global methane concentrations. The graph uses land-based measurements taken at sea level that can miss methane rising from the seafloor, especially from the seafloor of the Arctic Ocean, since there are few measuring stations in the Arctic in the first place. Land-based measurements can additionally overlook methane that is moving along the Tropopause from the Arctic toward the Equator.

Ominously, the image below shows high methane levels at Barrow, Alaska, at the end of January 2020.


Rising CO₂ levels are also worrying. A daily average CO₂ level of 415.79 ppm was recorded by NOAA at Mauna Loa, Hawaii, on January 21, 2020, a level that is unprecedented for millions of years. Since an annual peak is typically reached in May, we can expect even higher levels over the coming months.


It's not just at Mauna Loa that such high CO₂ readings were recorded recently. The image below shows CO₂ levels recorded recent;y at Barrow, Alaska.


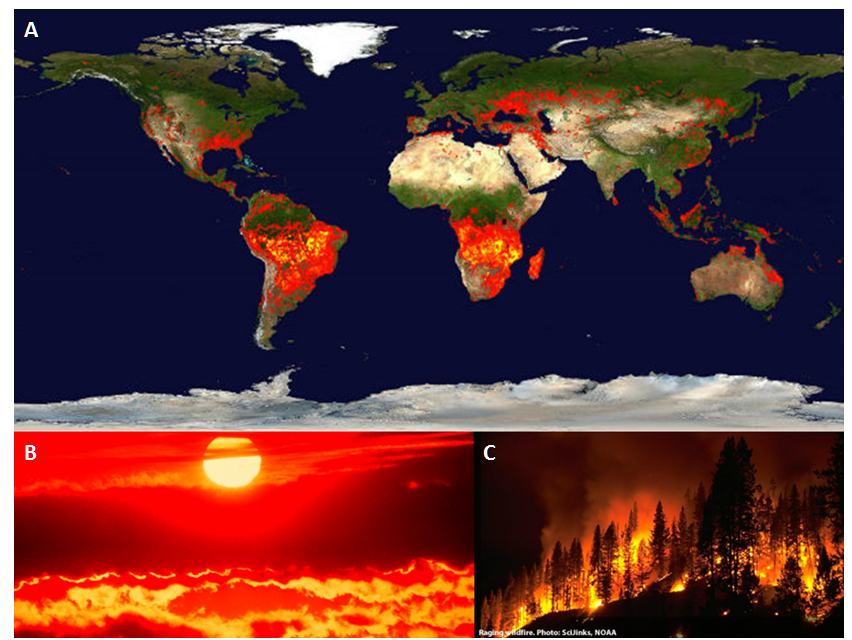
Fires in Australia have contributed to these high CO₂ levels. The image below shows smoke plumes from fires in Australia on January 4, 2020.


Such fires can generate huge amounts of smoke, with smoke rising up high in the atmosphere and entering the stratosphere, while circumnavigating Earth. The ferocity of these fires is also shown in the NASA video below.


In the video below, Guy McPherson gives examples of species that went extinct rapidly.


Meanwhile, the Bulletin of the Atomic Scientists has moved the Doomsday Clock closer to Midnight, to 100 seconds to Midnight, adding that Civilization-ending nuclear war—whether started by design, blunder, or simple miscommunication—is a genuine possibility. Climate change that could devastate the planet is undeniably happening. And for a variety of reasons that include a corrupted and manipulated media environment, democratic governments and other institutions that should be working to address these threats have failed to rise to the challenge. Faced with a daunting threat landscape and a new willingness of political leaders to reject the negotiations and institutions that can protect civilization over the long term, the Bulletin of the Atomic Scientists Science and Security Board moved the Doomsday Clock 20 seconds closer to midnight—closer to apocalypse than ever. 

The image below, created with thebulletin.org content and data from 1991 to 2020, has a linear trend added that points at Midnight by 2022.


The situation is dire and calls for immediate, comprehensive and effective action, as described in the Climate Plan.


Links

• Extinction in 2020?
https://arctic-news.blogspot.com/2019/12/extinction-in-2020.html

• NOAA Global Climate Report - Annual 2019 - Monthly temperature anomalies versus El Niño
https://www.ncdc.noaa.gov/sotc/global/201913/supplemental/page-2

• Record-Setting Ocean Warmth Continued in 2019 - by Lijing Chang et al.
https://link.springer.com/article/10.1007/s00376-020-9283-7

• 2020 El Nino could start 18°C temperature rise
https://arctic-news.blogspot.com/2019/11/2020-el-nino-could-start-18-degree-temperature-rise.html

• Near-Term Human Extinction
http://arctic-news.blogspot.com/2014/04/near-term-human-extinction.html

• NOAA Global CH4 Monthly Means
https://www.esrl.noaa.gov/gmd/ccgg/trends_ch4

• Methane Erupting From Arctic Ocean Seafloor
http://arctic-news.blogspot.com/2017/03/methane-erupting-from-arctic-ocean-seafloor.html

• NASA: Global Transport of Smoke from Australian Bushfires
https://gmao.gsfc.nasa.gov/research/science_snapshots/2020/Australia_fires_smoke.php

• NASA: Global Transport of Australian Bushfire Smoke
https://climate.nasa.gov/climate_resources/202/global-transport-of-australian-bushfire-smoke

• Bulletin of the Atomic Scientists
https://thebulletin.org/doomsday-clock/past-statements/

• Doomsday by 2021?
https://arctic-news.blogspot.com/2018/11/doomsday-by-2021.html

• Climate Plan
https://arctic-news.blogspot.com/p/climateplan.html


Wednesday, January 15, 2020

The Australian firestorms: portents of a planetary future

by Andrew Glikson
Earth and climate scientist
Australian National University

Global warming and its disastrous consequences are now truly with us since the second part of 2019. At the moment a change in the weather has given parts of the country a respite from the raging fires, some of which are still burning or smoldering, waiting for another warm spell to flare up. The danger zones include the Australian Capital Territory, from where these lines are written. To date, 18.6 million hectares (186,000 square kilometers) were burnt, including native forests, native animals, homesteads and towns, and 24 people died. The firestorms betray harbingers of a planetary future, or a lack of such, under ever rising temperatures and extreme weather events inherent in fossil fuel driven global warming.

Global heating

As the atmospheric concentration of the well-mixed greenhouse gases rise (CO₂ >411.76 ppm; CH₄ >1870.5 ppb; N₂O >333 ppb plus trace greenhouse gases) land temperatures soar (NASA global sea-land mean of 1.05°C since 1880). According to Berkeley Earth global land temperatures have increased by 1.5C over the past 250 years and mean Arctic temperatures have risen by 2.5°C to 3.0°C between 1900 and 2017. According to NASA :
  1. “Extreme heatwaves will become widespread at 1.5 degrees Celsius warming. Most land regions will see more hot days, especially in the tropics.
  2. At 1.5°C about 14 percent of Earth’s population will be exposed to severe heatwaves at least once every five years, while at 2 degrees Celsius warming that number jumps to 37 percent.”
  3. “Risks from forest fires, extreme weather events and invasive species are higher at 2 degrees warming than at 1.5 degrees warming.”
  4. “Ocean warming, acidification and more intense storms will cause coral reefs to decline by 70 to 90 percent at 1.5 degrees Celsius warming, becoming all but non-existent at 2 degrees warming.”
Figure 1. The distribution of global fires. NASA.

However, bar the transient masking effects of sulphur aerosols, which according to estimates by Hansen et al. (2011) induce more than 1.0°C of cooling, global temperatures have already reached near 2.0°C (by analogy to the requirement for a patient’s body temperature to be measured before and not after aspirin has been taken). As aerosols are not homogeneously distributed, in some parts of the world temperatures have already soared to such levels. Thus the degree to which aerosols cool the earth, which depends on aerosol particle size range, has been grossly underestimated.

The rate of global warming, at ~2 to 3 ppm year and ~1.5°C in about one century, faster by an order of magnitude then geological climate catastrophe such as the PETM and the KT impact, has taken scientists by surprise, requiring a change from the term climate change to climate calamity.

The Australian firestorms

In Australia mean temperatures have risen by 1.5°C between 1910 and 2019 (Figure 2), as a combination of global warming and the ENSO conditions, as reported by the Bureau of Meteorology.

“The Indian Ocean Dipole (IOD) has returned to neutral after one of the strongest positive IOD events to impact Australia in recent history ... the IOD’s legacy of widespread warm and dry conditions during the second half of 2019 primed the Australian landscape for bushfire weather and heatwaves this summer. In the Pacific Ocean, although indicators of the El Niño–Southern Oscillation (ENSO) are neutral, the tropical ocean near and to the west of the Date Line remains warmer than average, potentially drawing some moisture away from Australia.”

Figure 2. (A) Australian mean temperature. (B) Severe fire weather. (C) Drought. (D) Driest year.
Bureau of Meteorology
The prolonged drought (Figure 2 C, D), low fuel moisture, high temperatures (Figure 2A) and warm winds emanating from the inland have rendered large parts of the Australian continent tinder dry, creating severe fire weather (Figure 2B) subject to ignition by lightning and human factors. Fires on a large scale create their own weather (see: bushfire raging in Mount Adrah and firestorm). Observations of major conflagrations, including the 2003 Canberra fires, indicate fires can form atmospheric plumes which can migrate and as hot plumes radiating toward the ground (fire tornadoes).

The underlying factor for rising temperatures and increasingly severe droughts in Australia is the polar-ward shift in climate zones (see map Oceania) as the Earth warms, estimated as approximately 56-111 km per decade, where dry hot subtropical zones encroach into temperate zones, as is also the case in South Africa and the Sahara.

Smoke signals emanating from the Australian fires are now circling around the globe (Figure 3) signaling a warning of the future state of Earth should Homo sapiens, so called, not wake up to the consequences of its actions.

Figure 3. (A) Smoke emanating from the southeastern Australian fires (January 4, 2020);
(B) smoke from the pyro-cumulonimbus clouds of the Australian fires drifting across the Pacific Ocean.
The fire clouds have lofted smoke to unusual heights in the atmosphere. The CALIPSO satellite observed smoke soaring between 15 to 19 kilometers on January 6, 2020—high enough to reach the stratosphere. NASA.


Andrew Glikson
Dr Andrew Glikson
Earth and climate scientist
Australian National University


Thursday, December 26, 2019

Planetary arson and amplifying feedbacks: No alternative to CO2 drawdown

by Andrew Glikson
Earth and climate scientist
Australian National University

No one knows how to impose 1.5 or 2.0 degrees Celsius limits on the mean global temperature, unless drawdown/carbon sequestration of atmospheric CO₂ is attempted, nor are drawdown methods normally discussed in most political or economic forums. According to Kevin Drum (2019)“Meeting the climate goals of the Paris Agreement is going to be nearly impossible without removing carbon dioxide from the atmosphere”.

The release of some 910 billion tons of carbon dioxide is leading human society, indeed much of nature, to an existential impasse. The widest chasm has developed between what climate science is indicating and between climate policies and negotiations controlled by governments, politicians, economists and journalists—none of whom fully comprehends, or is telling the whole truth about, the full consequences of the current trend in the atmosphere-ocean-land system.

The evidence for future projections, as understood by climate scientists, has been largely put to one side, mainly because it is economically and politically “inconvenient” or is frightening. Reports from the Madrid climate COP-25 Conference suggest negotiations, focusing on emission reductions, are overlooking the evidence that at the current concentration of CO₂, which have reached 412 ppm and 496 ppm-equivalent (when the CO₂-equivalents of methane and nitrous oxide are included), amplifying feedbacks from land and ocean are pushing temperatures further upwards. This is driven by the replacement of sea ice and land ice and snow surfaces by open water surfaces, by methane leaks, desiccated vegetation, fires and reduced CO₂ absorption by warming oceans. Given the long atmospheric residence time of CO₂ (Solomon et al. 2009, Eby et al. 2009) and the short life span of aerosols, attempts at CO₂ drawdown are essential if complete devastation of the biosphere is to be avoided.
Figure 1. (A) 1990-2019 Global growth of CO₂ emissions (gigaton);
(B) 1960-2019 Annual fossil CO₂ emissions from coal, oil, natural gas and cement (gigaton).
From: CSIRO News Release
The prevailing political and economic focus in international climate projects, conferences and advisory councils is concerned with (a) limits on, or a decrease of, carbon emissions from power generation, industry, agriculture, transport and other sources; (b) limits on the current rise in global temperatures to +1.5 degrees Celsius, and a maximum of +2.0 degrees Celsius, above mean pre-industrial (pre-1750) temperatures.

However, no one knows how to impose these limits unless drawdown/sequestration of atmospheric CO₂ is attempted, nor are drawdown methods normally discussed in most forums.

Figure 2. (A) Distribution of global fires (NASA);
 (B) Fire storms over the southwest USA;
(C) Pine forest fire California.
At the present the concentration of greenhouse gases of just under-500 ppm CO₂-equivalent is activating amplifying feedbacks of greenhouse gases from land, oceans and melting ice sheets, namely further warming:
  1. An increase in evaporation due to warming of land and oceans leads to further warming due to the greenhouse effect of water vapor but also to increased cloudiness which retards warming. The water vapor factor, significant in the tropics, is somewhat less important in the dry subtropical zones and relatively minor in the Polar Regions (Figure 3).
  2. The melting of ice sheets, reducing reflective (high-albedo) ice and snow surfaces, and concomitant opening of open water surfaces (heat absorbing low-albedo) is generating a powerful positive (warming) feedback. Hudson (2011) estimates the rise in warming due to total removal of Arctic summer sea ice as approximately +1.0 degrees Celsius.
  3. The release of methane from melting permafrost and bubbling of methane hydrates from the oceans has already raised atmospheric methane levels from about 800 to 1863 parts per billion which, given the radiative forcing of methane of X25< times, renders methane highly significant.
  4. As the oceans warm they become less capable of taking up carbon dioxide. As a result, more of our carbon pollution will stay in the atmosphere, exacerbating global warming. 
  5. As tropical and subtropical climate zones overtake temperate Mediterranean-type climate zones, desiccated and burnt vegetation release copious amounts of carbon dioxide to the atmosphere. For example the current bushfires in Australia have already emitted 250 million tonnes of CO₂, almost half of country's annual emissions in 2018.
Figure 3. Total water vapor that can precipitate, as observed by
the Atmospheric Infrared Sounder (AIRS) on NASA's Aqua satellite.
With rising global temperatures and further encroachment of subtropical climate zones desertification and warming can only become more severe.

Abrupt reductions in emissions may be insufficient to stem global warming, unless accompanied by sequestration of greenhouse gases from the atmosphere, recommended as below 350 ppm CO₂. According to Hansen et al. (2008) carbon sequestration in soil (the biochar method) has significant potential, applying pyrolysis of residues of crops, forestry and animal waste. Biochar helps soil retain nutrients and fertilizers, reducing release of greenhouse gases such as N₂O. Replacing slash-and-burn agriculture with a slash-and-char method and the use of agricultural and forestry wastes for biochar production could provide a CO₂ drawdown of ~8 ppm or more in half a century.

Stabilization and cooling of the climate could include two principle approaches (Table 1): (a) solar shielding, and (b) CO₂ drawdown/sequestration. However, solar shielding by injected aerosols or water vapor is bound to be transient, requiring constant replenishment.

Table 1. Solar shielding and atmospheric CO₂ sequestration methods.
Method
Supposed advantages
Problems
SO2 injections
Relatively cheap and rapid application
Short atmospheric residence time; ocean acidification; retardation of precipitation and of monsoons
Space satellite-mounted sunshades/mirrors
Rapid application. No direct effect on ocean chemistry
Longer space residence time. Does not mitigate ocean acidification by CO2 emissions.
Streaming of air through basalt and serpentine
(Figure 4)
CO2 capture by Ca and Mg carbonates
In operation on a limited scale in Iceland. Significant potential 
Soil carbon burial/biochar
Effective means of controlling the carbon cycle (plants+ soil exchange more than 100 GtC/year with the atmosphere) 
Requires a collaborative international effort by millions of farmers. Significant potential
CO2 capture by seaweeds 
An effective method applied in South Korea 
Decay of seaweeds releases CO₂ to ocean water. Significant potential
Ocean iron filing fertilization enhancing phytoplankton
CO2 sequestration
Phytoplankton residues would release CO2 back to the ocean water and atmosphere.
Ocean pipe system for vertical circulation of cold water to enhance CO2 sequestration
CO2 sequestration
Further warming would render such measure transient.
“Sodium trees” – pipe systems of liquid NaOH sequestering CO2 to sodium carbonate Na2CO3, followed by separation and burial of CO2.
CO2 sequestration, estimated by Hansen et al. (2008) at a cost of ~$200/ton CO₂ where the cost of removing 50 ppm of CO₂ is ~$20 trillion.
Unproven efficiency; need for CO2 burial; $trillions expense, though no more than the military expenses since WWII.

Figure 4. Iceland: The streaming of CO₂-containing air and of water through
basaltic rocks and CO₂-capture as carbonate minerals.
The big question is how effective are the above methods in reducing CO₂ levels on a global scale, at the very least to balance emissions, currently 36.8 billion tons CO₂ per year. Whereas each of the methods outlined in Table 1 has advantages and disadvantages, it is hard to see an alternative way of cooling the atmosphere and oceans than a combination of several of the more promising methods. Budgets on a scale of military spending ($1.7 trillion in 2017) are required in an attempt to slow down the current trend across climate tipping points. The choice humanity is facing is whether to spend resources on this scale on wars or on defense from the climate calamity.

Time is running out.

Andrew Glikson
Dr Andrew Glikson
Earth and climate scientist
Australian National University


Books:

- The Archaean: Geological and Geochemical Windows into the Early Earth
- The Asteroid Impact Connection of Planetary Evolution
- Asteroids Impacts, Crustal Evolution and Related Mineral Systems with Special Reference to Australia
- Climate, Fire and Human Evolution: The Deep Time Dimensions of the Anthropocene
- The Plutocene: Blueprints for a Post-Anthropocene Greenhouse Earth
- Evolution of the Atmosphere, Fire and the Anthropocene Climate Event Horizon
- From Stars to Brains: Milestones in the Planetary Evolution of Life and Intelligence


Tuesday, December 17, 2019

Extinction in 2020?


Above image depicts how humans could go extinct as early as 2020. The image was created with NASA LOTI 1880-Nov.2019 data, 0.78°C adjusted to reflect ocean air temperatures (as opposed to sea surface temperatures), to reflect higher polar temperature anomalies (as opposed to leaving out 'missing' data) and to reflect a 1750 baseline (as opposed to a 1951-1980 baseline), with two trends added. Blue: a long-term trend based on Jan.1880-Nov.2019 data. Red: a short-term trend, based on Jan.2009-Nov.2019 data, to illustrate El Niño/La Niña variability and how El Niño could be the catalyst to trigger huge methane releases from the Arctic Ocean.

How was above image created? Let's first look at the baseline. The NASA default baseline is 1951-1980. The added trend in the image below shows early 1900s data to be well below this 1951-1980 baseline. In this analysis, a 0.28°C adjustment was therefore used to reflect this, and to reflect a 1750 baseline, a further 0.3°C was used, adding up to a 0.58°C baseline adjustment.


Furthermore, the NASA Land+Ocean temperature index (LOTI) uses sea surface temperatures, but ocean air temperatures seem more appropriate, which adds a further 0.1°C adjustment. Also, when comparing current temperatures with preindustrial ones, it's hard to find data for the polar areas. Treating these data as 'missing' would leave important heating out of the picture. After all, the polar areas are heating up much faster than the rest of the world, and especially so in the Arctic region. Therefore, a further 0.1°C adjustment was used to reflect higher polar temperature anomalies, resulting in the above-mentioned 0.78°C adjustment.

Finally, the red trend illustrates El Niño/La Niña variability. As discussed in a recent post, an El Niño is forecast for 2020 and this could be the catalyst to trigger huge methane releases from the Arctic Ocean.

The image below shows El Niño/La Niña variability going back to 1950, added to the NOAA monthly temperature anomaly.


As said, the Arctic region is heating up much faster than the rest of the world. There are several reasons why this is the case. Decline of the sea ice makes that less sunlight gets reflected back into space and that more sunlight is reaching the Arctic Ocean. This also causes more water vapor and clouds to appear over the Arctic Ocean. Furthermore, Arctic sea ice has lost most of the thicker multi-year ice that used to extend meters below the surface, consuming huge amounts of ocean heat entering the Arctic Ocean along ocean currents from the North Atlantic and the North Pacific oceans.

[ created with NOAA Arctic Report Card 2019 image ]
Above-mentioned feedbacks (albedo changes and more water vapor and clouds) contribute to higher temperatures in the Arctic. Furthermore, as the temperature difference between the North Pole and the Equator narrows, the jet stream changes, which can lead to further Arctic heating, i.e. higher temperatures of the atmosphere over the Arctic Ocean and over land around the Arctic Ocean, which in turn causes higher temperatures of the water flowing into the Arctic Ocean from rivers.

Furthermore, jet stream changes can also cause additional heating of parts of the Pacific Ocean and the Atlantic Ocean.

[ click on images to enlarge ]
Above image shows that sea surface temperature anomalies off the East Coast of North America as high as 13.6°C or 24.4°F were recorded on December 18, 2019.

Ocean currents can bring huge amounts of heat into the Arctic Ocean, and this can be amplified due to cyclones speeding up the inflow of water from the Atlantic Ocean and the Pacific Ocean into the Arctic Ocean.


As above image shows, the temperature rise of the oceans on the Northern Hemisphere is accelerating. This constitutes a critical tipping point, i.e. there are indications that a rise of 1°C will result in most of the sea ice underneath the surface to disappear. This sea ice used to consume the inflow of warm, salty water from the Atlantic Ocean and the Pacific Ocean. So, while there may still be sea ice left at the surface, since low air temperatures will cause freezing of surface water, the latent heat buffer has gone.


As long as there is sea ice, this will keep absorbing heat as it melts, so the temperature will not rise at the sea surface. The amount of energy absorbed by melting ice is as much as it takes to heat an equivalent mass of water from zero to 80°C.

The danger is that, as Arctic Ocean heating accelerates further, hot water will reach sediments at the Arctic Ocean seafloor and trigger massive methane eruptions, resulting in a huge abrupt global temperature rise. As discussed in an earlier post, a 3°C will likely suffice to cause extinction of humans.


Earlier this year, an Extinction Alert was issued, followed by a Stronger Extinction Alert.

In a rapid heating scenario:
  1. a strong El Niño would contribute to
  2. early demise of the Arctic sea ice, i.e. latent heat tipping point +
  3. associated loss of sea ice albedo,
  4. destabilization of seafloor methane hydrates, causing eruption of vast amounts of methane that further speed up Arctic warming and cause
  5. terrestrial permafrost to melt as well, resulting in even more emissions,
  6. while the Jet Stream gets even more deformed, resulting in more extreme weather events
  7. causing forest fires, at first in Siberia and Canada and
  8. eventually also in the peat fields and tropical rain forests of the Amazon, in Africa and South-east Asia, resulting in
  9. rapid melting on the Himalayas, temporarily causing huge flooding,
  10. followed by drought, famine, heat waves and mass starvation, and
  11. collapse of the Greenland Ice Sheet.
[ from an earlier post ]

The precautionary principle calls for appropriate action when dangerous situations threaten to develop. How can we assess such danger? Risk is a combination of probability that something will eventuate and severity of the consequences. Regarding the risk, there is growing certainty that climate change is an existential threat, as discussed in a recent post. There's a third dimension, i.e. timescale. Imminence alone could make that a danger needs to be acted upon immediately, comprehensively and effectively. While questions may remain regarding probability, severity and timescale of the dangers associated with climate change, the precautionary principle should prevail and this should prompt for action, i.e. comprehensive and effective action to reduce damage is imperative and must be taken as soon as possible.

The image below gives a visual illustration of the danger.


Polynomial trendlines can point at imminent danger by showing that acceleration could eventuate in the near future, e.g. due to feedbacks. Polynomial trendlines can highlight such acceleration and thus warn about dangers that could otherwise be overlooked. This can make polynomial trendlines very valuable in climate change analysis. In the image below, the green linear trend and the blue polynomial trend are long-term trends (based on Jan.1880-Nov.2019 data), smoothing El Niño/La Niña variability, but the blue polynomial trend better highlights the recent temperature rise than the green linear trend does. The red short-term trend (based on Jan.2009-Nov.2019 data) has the highest R² (0.994) and highlights how El Niño could be the catalyst for huge methane eruptions from the Arctic Ocean, triggering a huge global temperature rise soon.


The image below, from an earlier post, explains the speed at which warming elements can strike, i.e. the rise could for a large part occur within years and in some cases within days and even immediately.


As the image below shows, peak methane levels as high as 2737 parts per billion (ppb) were recorded by the MetOp-2 satellite in the afternoon of December 20th, 2019, at 469 mb. Ominously, a large part of the atmosphere over the East Siberian Arctic Shelf (ESAS) is colored solid magenta, indicating methane levels above 1950 ppb.


The situation is dire and calls for immediate, comprehensive and effective action, as described in the Climate Plan.


Links

• NASA - GISS Surface Temperature Analysis (GISTEMP v4)
https://data.giss.nasa.gov/gistemp/maps/index_v4.html

• NOAA Northern Hemisphere ocean temperature anomalies through November 2019
https://www.ncdc.noaa.gov/cag/global/time-series/nhem/ocean/1/11/1880-2019

• NOAA - Monthly temperature anomalies versus El Niño
https://www.ncdc.noaa.gov/sotc/global/201911/supplemental/page-3

• 2020 El Nino could start 18°C temperature rise
https://arctic-news.blogspot.com/2019/11/2020-el-nino-could-start-18-degree-temperature-rise.html

• NOAA Arctic Report Card 2019
https://www.arctic.noaa.gov/Report-Card/Report-Card-2019

• Critical Tipping Point Crossed In July 2019
https://arctic-news.blogspot.com/2019/09/critical-tipping-point-crossed-in-july-2019.html

• Most Important Message Ever
https://arctic-news.blogspot.com/2019/07/most-important-message-ever.html

• Accelerating greenhouse gas levels
https://arctic-news.blogspot.com/2019/11/accelerating-greenhouse-gas-levels.html

• Debate and Controversy
https://arctic-news.blogspot.com/p/debate.html

• Extinction Alert
https://arctic-news.blogspot.com/2019/02/extinction-alert.html

• Stronger Extinction Alert
https://arctic-news.blogspot.com/2019/03/stronger-extinction-alert.html

• Abrupt Warming - How Much And How Fast?
http://arctic-news.blogspot.com/2017/05/abrupt-warming-how-much-and-how-fast.html

• Climate Plan
https://arctic-news.blogspot.com/p/climateplan.html